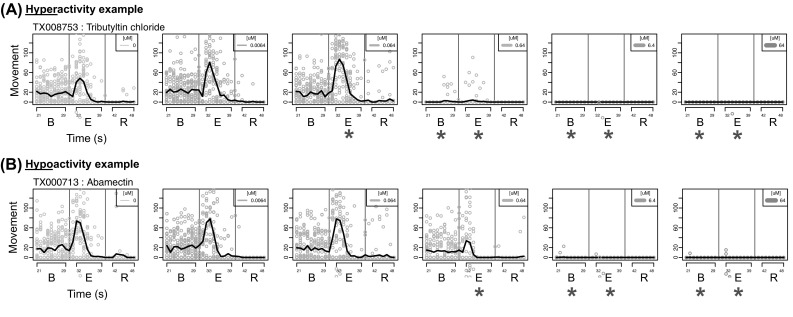
Fig. 2.

Detecting significant alterations in movement. The top panel shows movement (vertical axis, dimensionless index) versus time (horizontal axis, in sec) across all concentrations, increasing from left (control wells in the absence of chemical) to right (highest concentration = 64 µM). The vertical red lines indicate the timing of light pulses. Each circle represents movement at a given time for a replicate embryo well (32 replicates per chemical concentration combination). A locally weighted regression (LOESS) fit was plotted as a solid black line. The experimental intervals modeled in the behavioral analysis included background (B), excitatory (E), and refractory (R). Red asterisks denote significant responses for a particular concentration–time interval combination. The hyperactivity example chemical shown, tributyltin chloride, had an estimated lowest effect levels (LEL) of 0.064 μM for hyperactivity within the E interval and an LEL of 0.64 μM for hypoactivity within the B interval. The hypoactivity example chemical shown, abamectin, had estimated LELs of 6.4 μM in B and 0.64 μM in E (color figure online)
