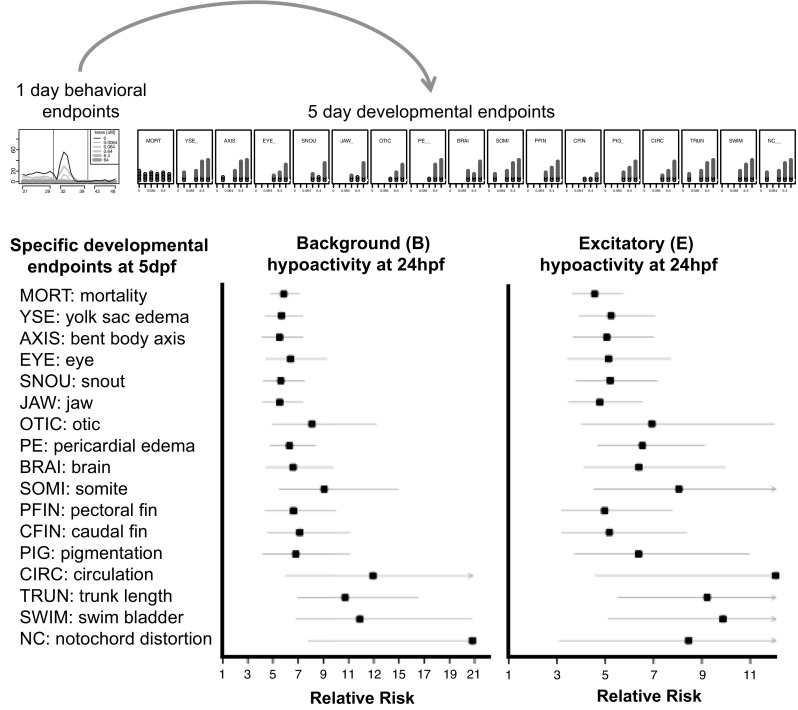
Fig. 4.

Predictive power of 24 hpf behavioral data. For chemicals eliciting significant hypoactivity within the B or E time interval in the 24 hpf behavioral data, the relative risk (RR) was estimated for each 5 dpf developmental endpoint. The plots show the estimated RR (solid square) and 95 % confidence intervals. For each plot, the vertical line indicates a RR = 1 (i.e., no evidence of association). The 24 hpf behavioral and 5 dpf developmental profiles atop the plots are for the chemical thiram
