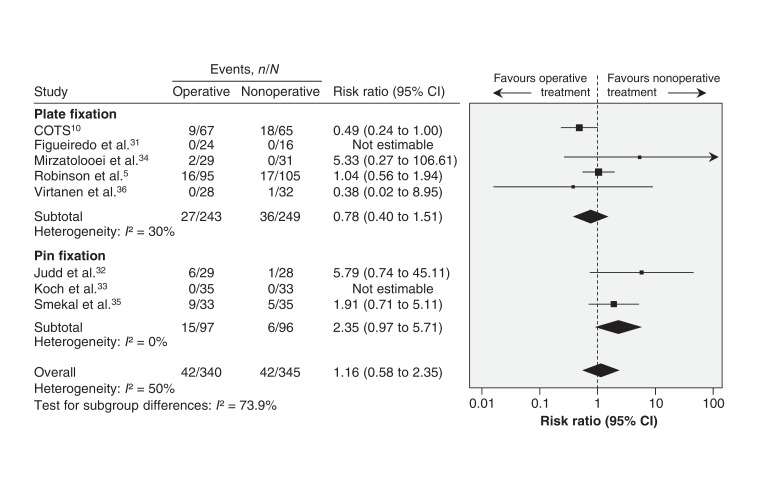
Figure 4.
Pooled estimates of secondary operation between operative and nonoperative groups. Values less than 1.0 favour operative treatment. Note: The N values in the study by Figueiredo et al. (24 operative, 16 nonoperative) are the numbers who completed the study and not the numbers initially randomized. CI = confidence interval.

