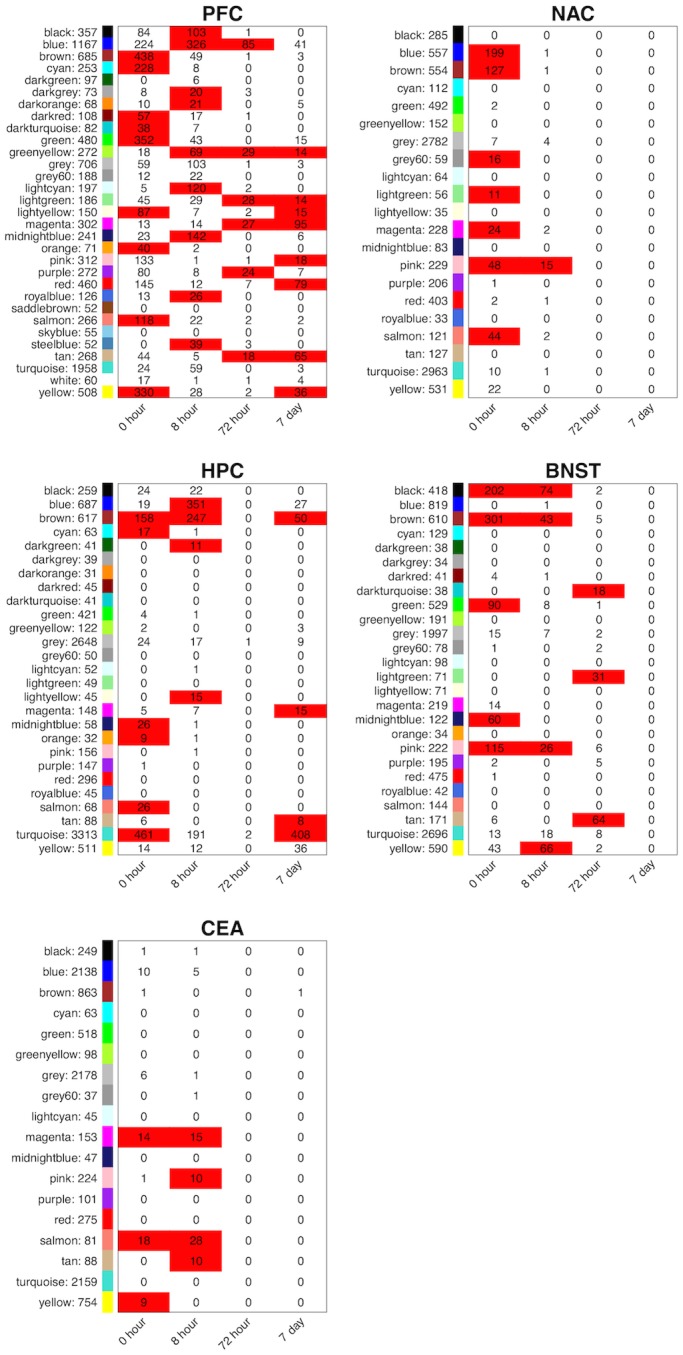
Fig 3. Overlap between CIE-regulated probesets and modules identified by WGCNA.

Cell numbers indicate number of overlapping probe-sets, Cell color indicates significant overlap. Significant overlap: p-value ≤ 0.005 and Odds Ratio ≥ 3. Names and number of genes for each module are listed at far left columns within each brain region.
