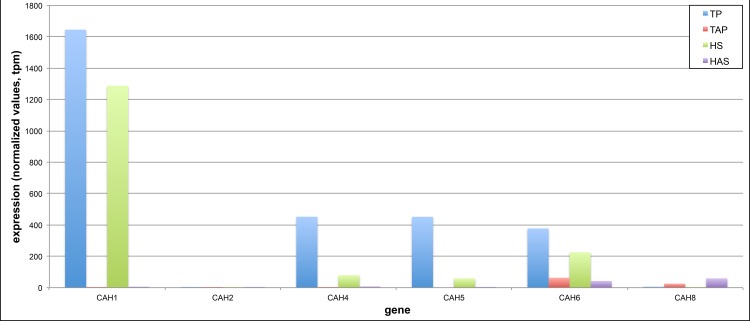
Fig 1. Comparative expression analysis of Chlamydomonas carbonic anhydrase (CAH) genes.
Cells grown in two different media types with and without acetate (TP–Tris-Phosphate, TAP–Tris-Phosphate-Acetate, HS–High-Salt, HAS–High-Salt-Acetate) were profiled for poly(A) site choice via construction of PATs followed by mapping of the tags to the annotated Chlamydomonas genome. Total PAT counts for each gene were normalized using the values from triplicate samples grown in the four different media types and presented as tags per million (tpm) for each of the genes shown. Phytozome 10.3 gene IDs for the CAHs used are as follows: CAH1 –Cre04.g223100, CAH2 –Cre04.g223050, CAH4 –Cre05.g248400, CAH5 –Cre05.g248450, CAH6 –Cre12.g485050, CAH8 –Cre09.g405750.

