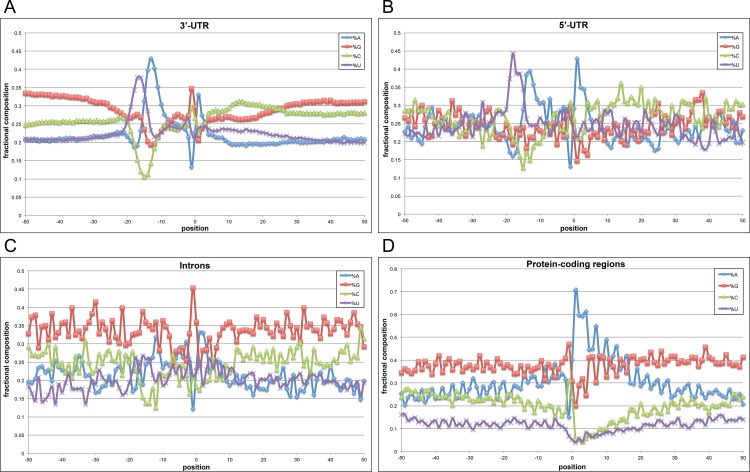
Fig 3. Position-by-position base composition of poly(A) sites for different genic regions in Chlamydomonas genes.
The panels shown depict the following genic regions: (A) 3’-UTRs, (B) 5’-UTRs, (C) introns, and (D) protein-coding regions. Y-axis values are the fractional nucleotide content at each position (plotted along the x-axis) with individual traces color-coded as indicated in the legend. On the x-axis, “0” denotes the actual cleavage/polyadenylation site–negative values represent positions that are 5’ (upstream) of the poly(A) site and positive values are positions 3’ (downstream) of the poly(A) site. Number of poly(A) sites used for each analysis are as follows: A = 39,412, B = 343, C = 311, and D = 840.

