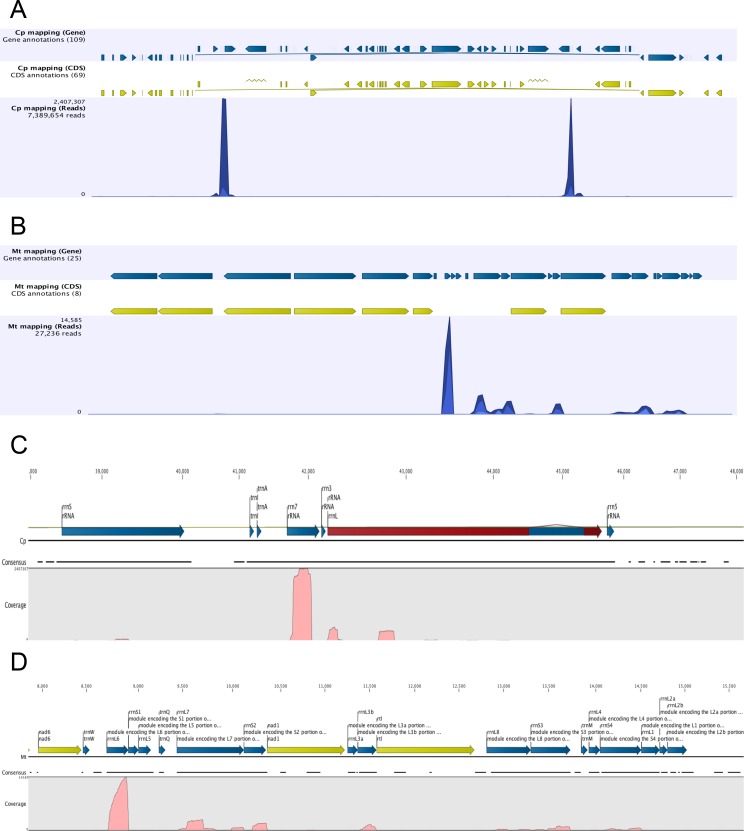
Fig 6. Genome browser views of PAT mappings to the Chlamydomonas chloroplast and mitochondrial genomes.
Panels A and B depict the results of mappings to the complete chloroplast and mitochondrial genomes, respectively, while C and D show mappings to the rRNA-encoding regions in the chloroplast and mitochondria, respectively (in the case of panel C, only one of the two chloroplast rRNA-encoding regions is shown). In panels A and B, the uppermost plots denote the locations of annotated genes, the middle plots show the locations of annotated protein-coding regions, and the lower plots are bar graphs representing the tag abundance across the genome. In panels C and D, the uppermost plots depict details of the gene annotations, the middle line (“consensus”) shows the overall extent of contiguous tag mappings, and the lower plots shows the relative tag abundances across the depicted genomic regions.

