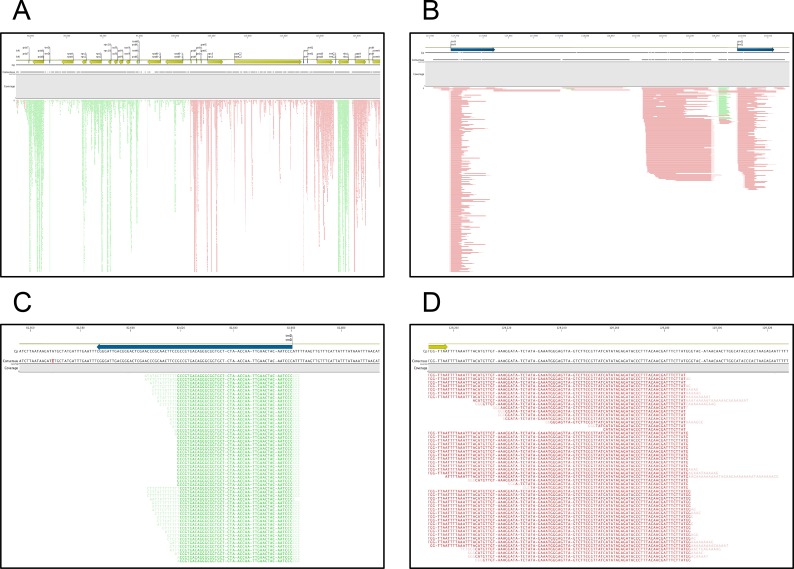
Fig 7. Details of poly(A) tracts for previously described Chlamydomonas chloroplast genes.
(A) Genome browser representation of tag mapping to a selected portion of the chloroplast genome that omits the rRNA-encoding regions. The uppermost plots depict details of the gene annotations, the middle line (“consensus”) shows the overall extent of contiguous tag mappings, and the lower plot shows the mappings of individual tags (green or red tics). Red and green tics denote tags oriented in the left-to-right (5’-3’) or right-to-left (5’-3’) directions. (B) Close-up browser view of reads that map to the chloroplast trnD gene. The sequences of the individual reads are visible; lettering in light shaded fonts denote extraneous sequence that does not map to the genome, but rather represents the mixed heteropolymeric tract as noted in the text. (D) Close-up browser view of reads that map to the chloroplast atpH gene. The sequences of the individual reads are visible; lettering in light shaded fonts denote extraneous sequence that does not map to the genome, but rather represents the mixed homopolymer as noted in the text.

