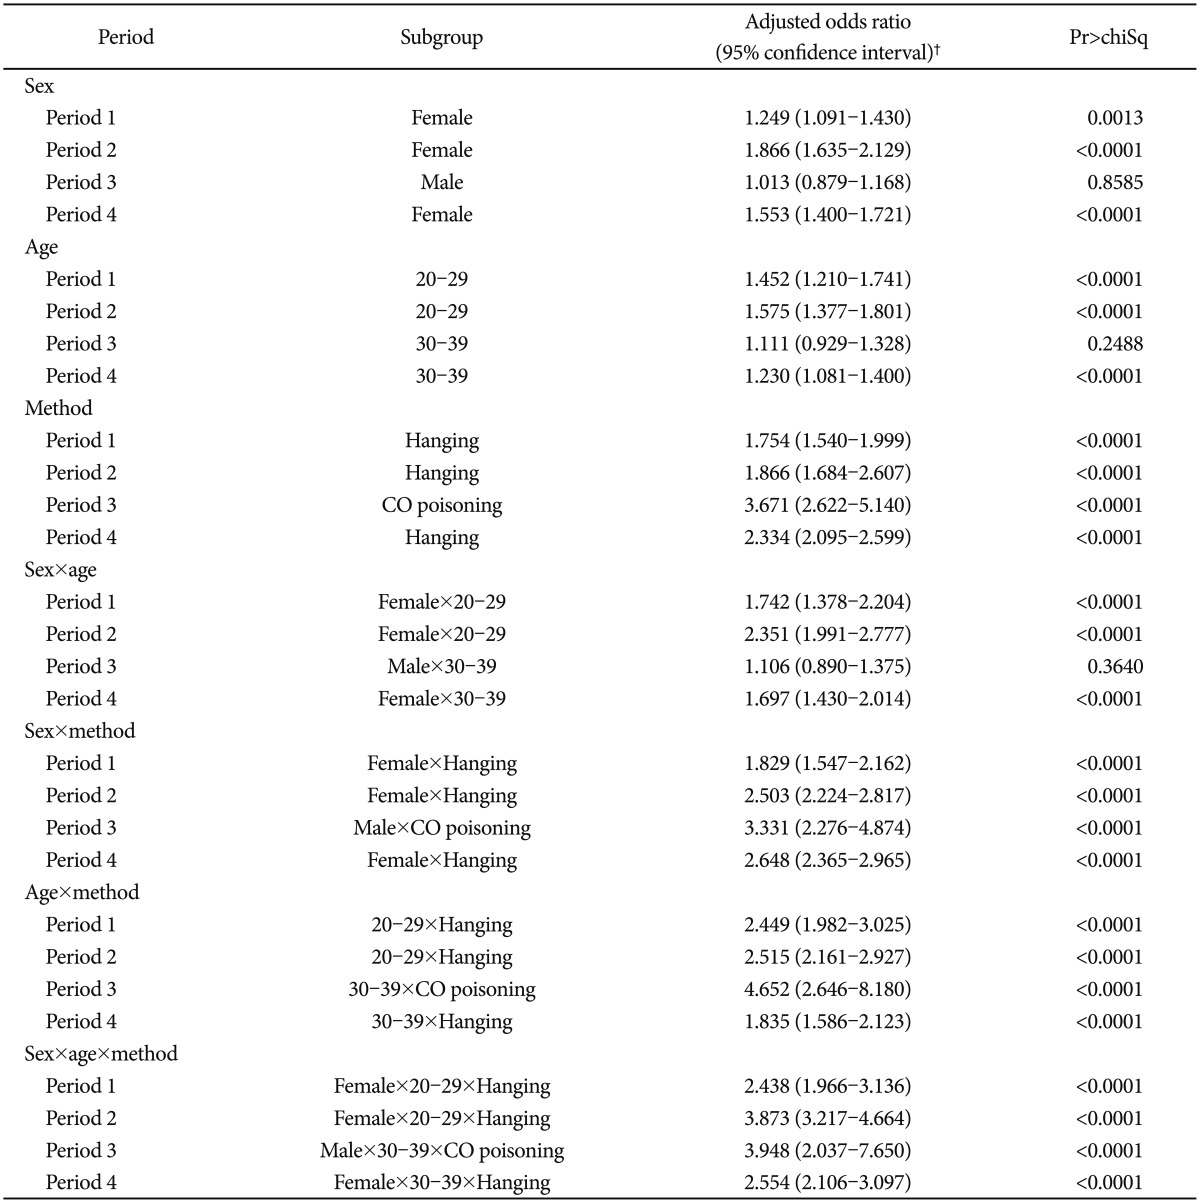
Table 3. Adjusted odds ratio for the number of suicides in subgroups that match the celebrity during each period affected by an entertainment celebrity suicide (South Korea, 2005-2008)*.
*logistic regression analysis model, adjusting for the effects of season, monthly variation, unemployment rate, sex, age and method, †for the same subgroups matching each celebrity during the previously-described affected period, using the other subgroups and the remainder of 2005-2008 as a reference

