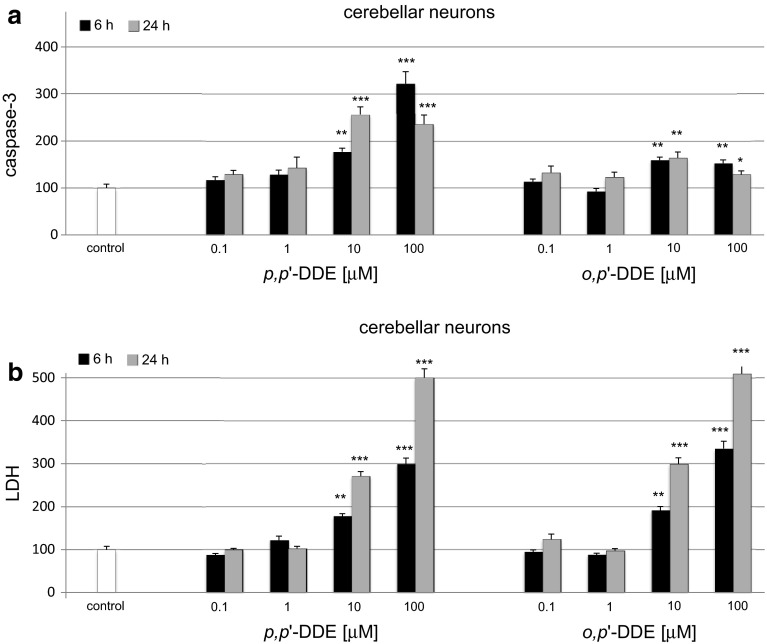
Fig. 3.
Time-course effects of p,p′-DDE and o,p′-DDE (0.1, 1, 10, 100 μM) on caspase-3 activity (a) and LDH release (b) in primary cultures of mouse cerebellar cells at 7 DIV. The cells were treated with p,p′-DDE or o,p′-DDE for 6 and 24 h. The results are presented as a percentage of the control. Each bar represents the mean of three to four independent experiments ± SEM. The number of replicates in each experiment ranged from 5 to 8. *p < 0.05, **p < 0.01 and ***p < 0.001 versus control cultures

