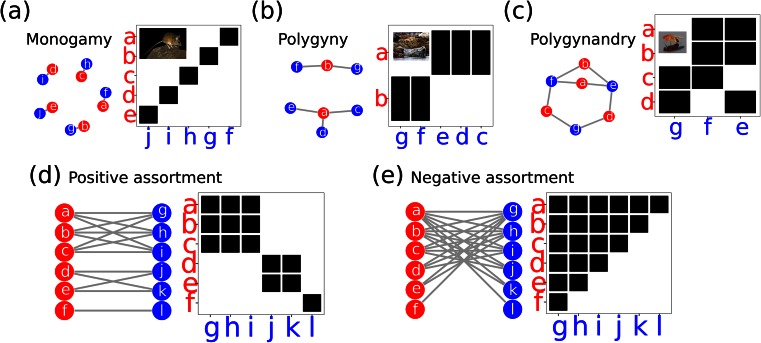
Fig. 1.
Each panel shows two visualisations of mating populations as sexual networks. Network visualisations show nodes representing individual males (red) or females (blue) and links (edges) represent copulations. Matrix representations show the same populations where males are rows, females are columns and filled squares represent copulations. a Monogamous population. b pPolygynyous population. c Polygynandrous population. d Example of positive mating assortativity (e) negative mating assortativity. Inset pictures courtesy of Wikimedia commons https://commons.wikimedia.org, from left to right: Californian mouse (Peromyscus californicus) by Whatiguana (Own work) [CC BY-SA 3.0 (http://creativecommons.org/licenses/by-sa/3.0) or GFDL (http://www.gnu.org/copyleft/fdl.html)], grey seal (Halichoerus grypus) by Steenbergs (Grey Seal On Farne Islands) [CC BY 2.0 (http://creativecommons.org/licenses/by/2.0)] and fruit fly (Drosophila melanogaster) by André Karwath aka Aka (Own work) [CC BY-SA 2.5 (http://creativecommons.org/licenses/by-sa/2.5)]

