
Fig. 5.
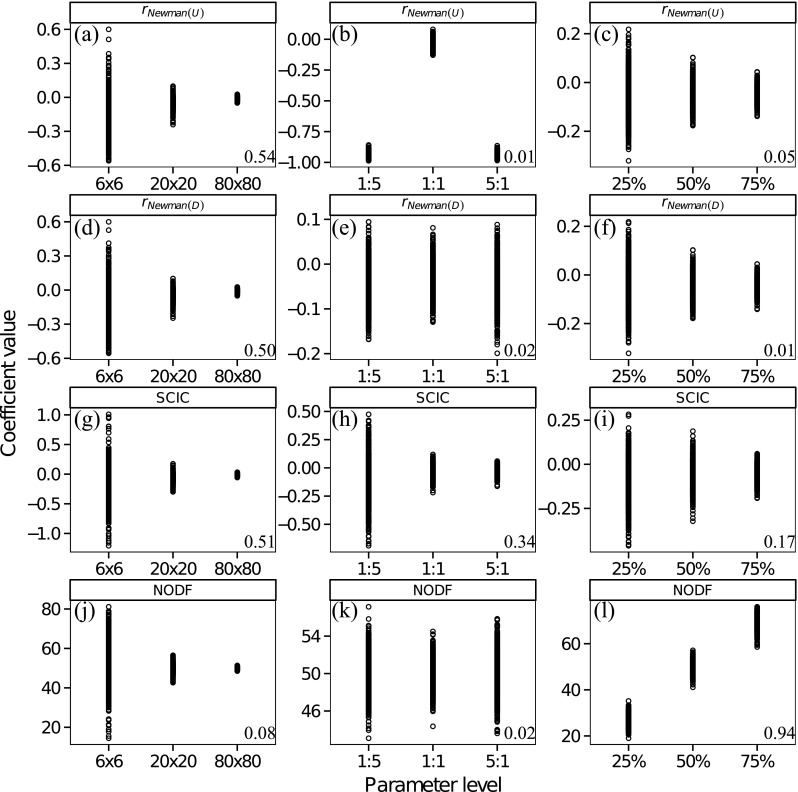
The relationship between measures of assortative mating structure (rNewman(U) (a–c, rNewman(D) (d–f), SCIC (g–i) and NODF (j–l) and population level parameters (population size (a, d, g, j)), sex ratio (males/females) (b, e, h, k) and ‘mating density’ (c, f, i, l) for randomly simulated mating populations. Numbers on the bottom right are the Spearman rank correlation coefficients