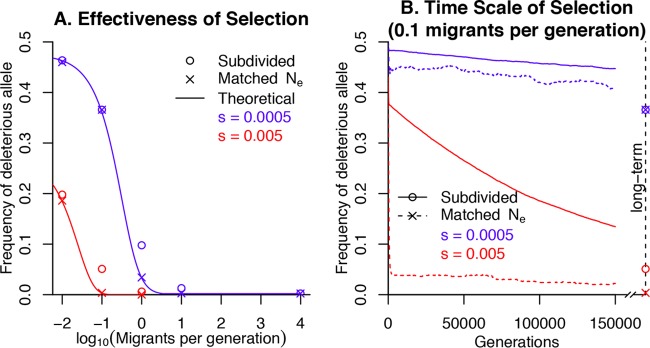
FIG 3 .
Selection in a subdivided population. We simulated the evolution of a weakly selected site with two alleles and equal mutation rates both ways (μ = 10−6) in a population of 10,000 haploid individuals divided into 100 subpopulations. (A) Under weak selection (s = 5 × 10⁻⁴ or s = 0.005), the average long-term frequency of the deleterious allele decreases as the migration rate rises. For comparison, we show simulations without population structure and with matching Ne (estimated from the subpopulation diversity). We also show theoretical predictions for the long-term frequency of the deleterious allele (given Ne). (B) The time scale of selection when there are 0.1 migrants per generation (Ne = 569). The x axis shows the number of generations, and the y axis shows the average frequency of the weakly deleterious allele. The right edge shows the long-term average frequency, as in panel A. At the beginning of each of 500 simulations, the deleterious allele had a frequency of 0.5: the early drop in allele frequencies is so rapid that it is barely visible in this plot.

