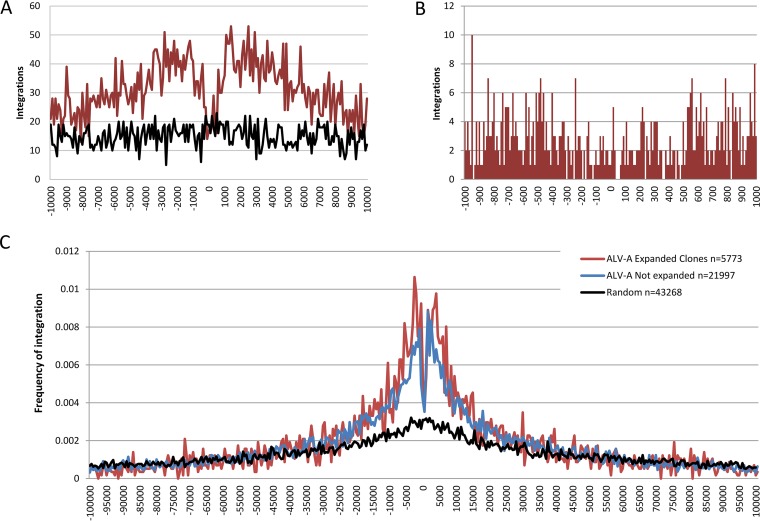
FIG 7 .
ALV integrations mapped with respect to transcription start sites. (A) Integrations within 10 kb of transcription start sites are shown placed into 100-bp bins. The red line represents ALV-A integrations, and the black line represents randomly simulated integrations. A preference for integration flanking TSSs is observed. (B) Integrations within 1 kb of TSSs are shown in 10-bp bins. A striking lack of integrations was observed in the immediate vicinity of TSSs. (C) Integration frequency was calculated for expanded clones (red), nonexpanded clones (blue), and randomly generated integrations (black), and integrations are presented in 500-bp bins. Integration frequency is the fraction of total integrations that fall into each 500-bp bin. Integrations near the TSS are shown to be slightly more likely to result in clonal expansion.

