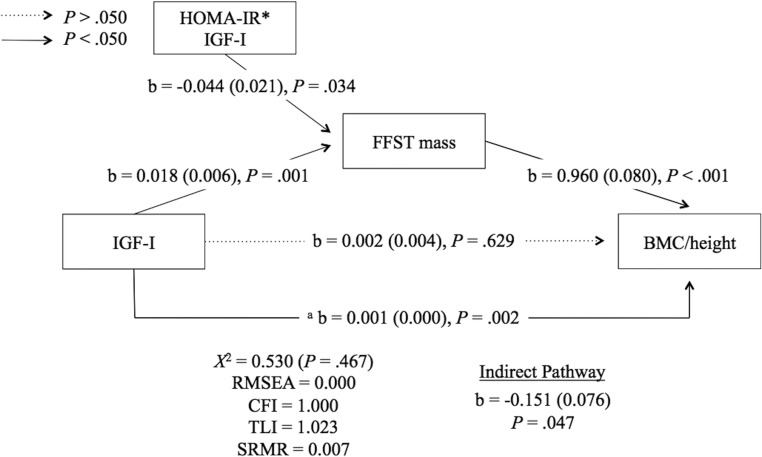
Figure 2.
Insulin resistance has a negative effect on the FFST mass-dependent relationship between IGF-1 and bone mass. The interaction between HOMA-IR and IGF-1 was tested at a cut-point of HOMA-IR = 4.0. Unstandardized regression coefficients are presented as b (standard error). Sexual maturation and HOMA-IR were included as covariates in this model but are not displayed. a Relationship between IGF-1 and BMC/height after adjusting for sexual maturation. Broken lines represent nonsignificant relationships. RMSEA, root mean square error of approximation; CFI, comparative fit index; TLI, Tucker-Lewis index; SRMR, standardized root mean square residual. HOMA-IR*IGF-I represents interaction between HOMA-IR and IGF-I.

