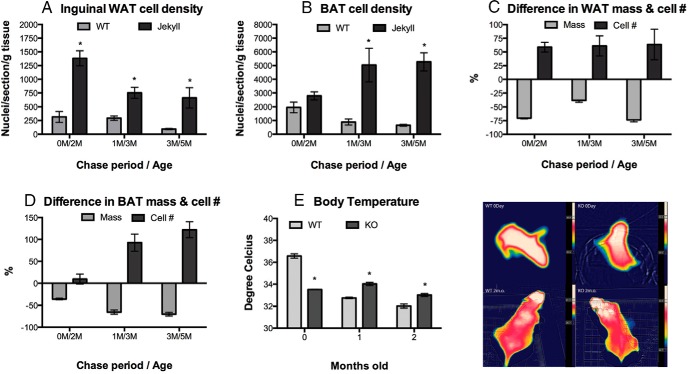
Figure 4.
Adipose cell density and surface body temperature. A and B, Total number of nuclei per sectioned tissue (inguinal WAT and BAT) was normalized to tissue weight. Significant differences between wild-type and Jekyll mice are indicated by asterisks (P ≤ .05, n = 6/group). C and D, Relative changes in tissue mass and cell number for Jekyll mice are expressed as a % of wild-type values (0 line; n = 6/group). E and F, Surface body temperature of wild-type and mstn−/− (KO) mice quantified and imaged. The temperature variations of each individual mouse are indicated by the thermal bars adjacent to the images. Significant differences between wild-type and Jekyll mice are indicated by asterisks (P ≤ .05, n = 6–8/group).

