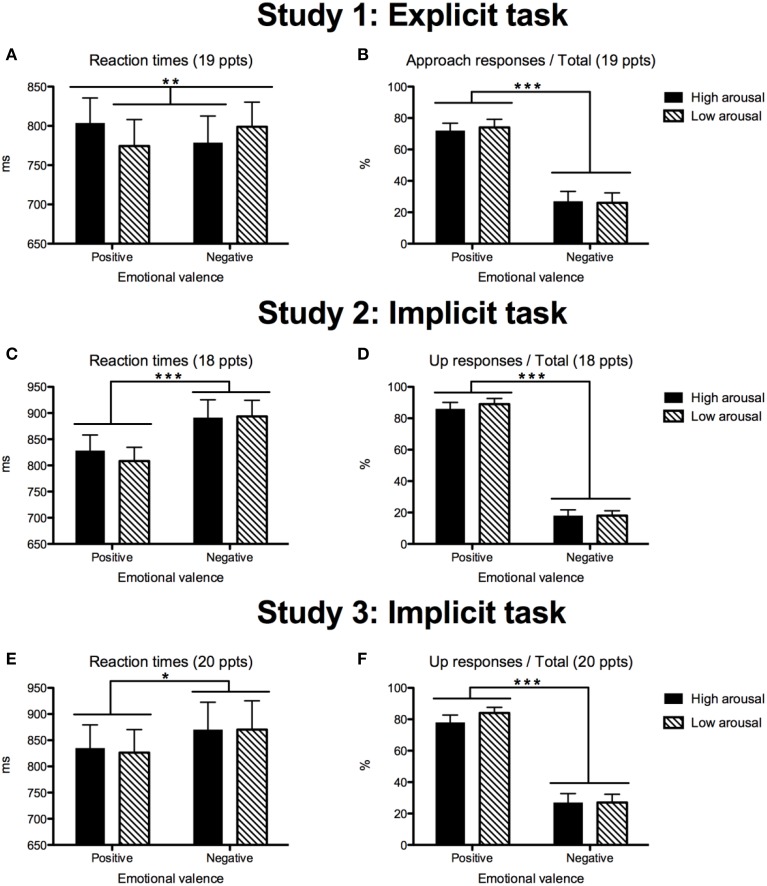
Figure 2.
Descriptive statistics (means + 1 standard error) of reaction times (in ms) and type of response (in percentages) for Study 1 (A,B), Study 2 (C,D), and Study 3 (E,F). The statistics are based on the analyses by participant. Significance levels are marked with stars: *p < 0.05; **p < 0.01; ***p < 0.001.

