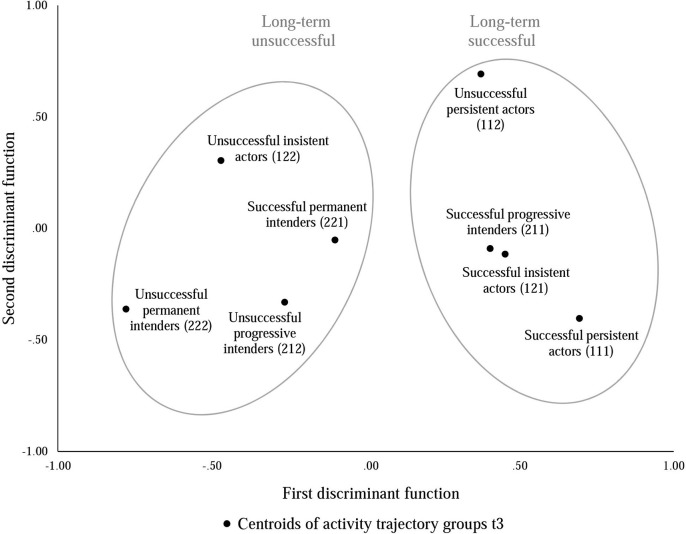
Figure 1.
Differentiation of activity groups according to first and second discriminant function. The centroids of activity groups represent the mean scores of the groups on both discriminant functions that are composed of the weighed predictors according to the equations of the two discriminant functions. Ellipses surrounding centroids represent group differentiation by the first discriminant function. The long-term unsuccessful ellipse also includes successful permanent intenders. This might result from the very recent success of this group after being unsuccessful for the majority of the study period.

