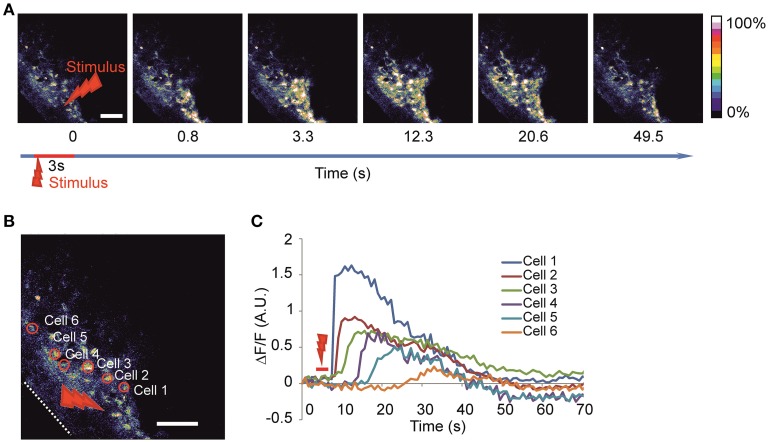
Figure 2.
Imaging of the evoked calcium waves (A) Time-lapse image of calcium wave evoked after laser stimulation of 3 s duration at 100% power (2 W before entering the object) in the round area of 20 μm in diameter. (B) Enlargement of the same imaged area with examples of identified active cells are delineated on the left panel and the corresponding fluorescence intensity traces (C) are shown on the right panel representing the calcium dynamics after stimulation in absolute ΔF/F-value. White dotted line delineates the surface of the head. Red arrow indicates stimulation area. Scale bar 100 μm.

