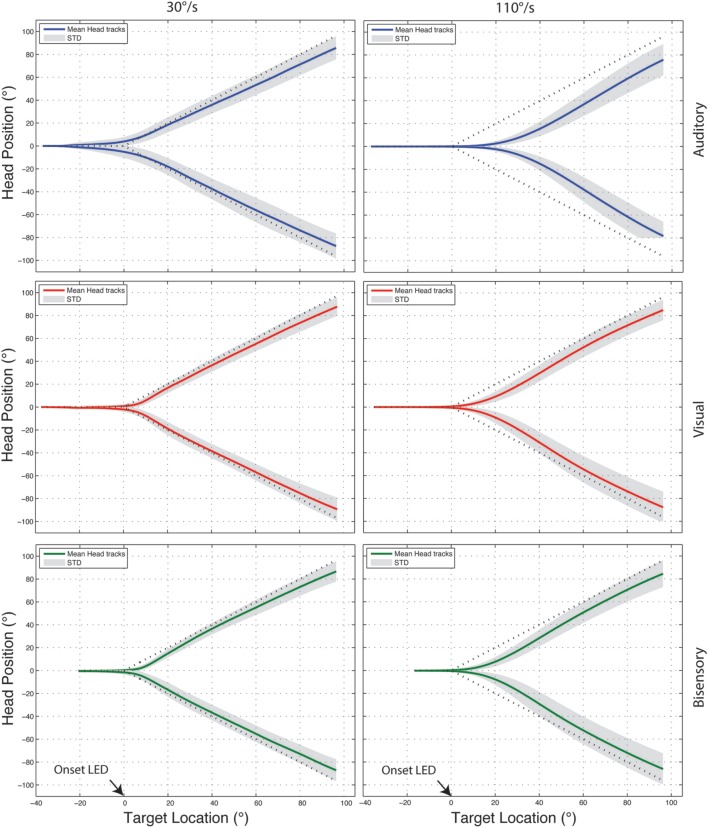
Figure 3.
Example head tracking traces for one subject tracking targets moving at 30 and 110°/s. Positive y-axis values correspond to rightward head motion and time is plotted on the X-axis. In all cases the head position averaged across 10 trials is shown with the standard deviation shaded in gray and the dotted line marking the ideal response. All three targets modalities are shown—auditory (blue), visual (red), bisensory (green).

