Figure 6.

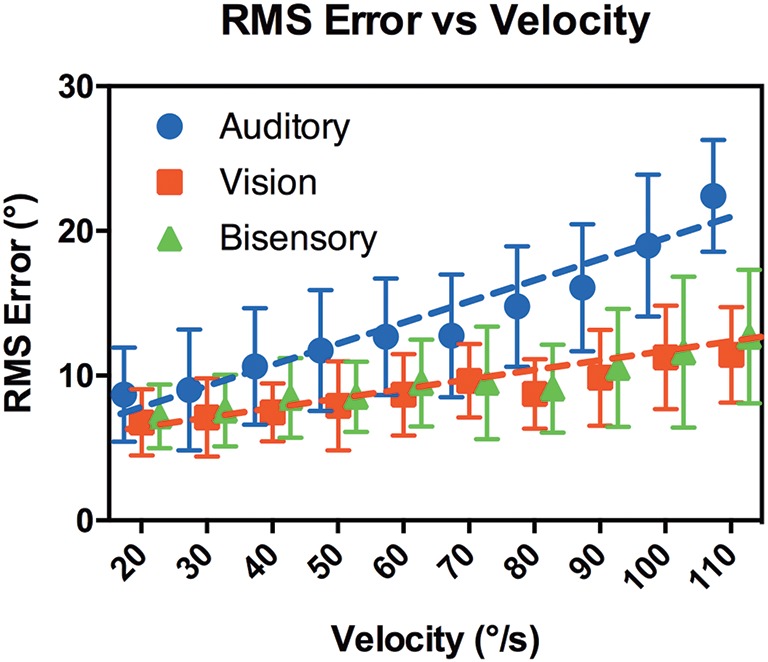
RMS error vs. target velocity. X-axis shows the target velocity, Y-axis shows the RMS error averaged across the subjects for each modality. Error bars denote 95% CI. The dotted lines are the lines of best fit.

RMS error vs. target velocity. X-axis shows the target velocity, Y-axis shows the RMS error averaged across the subjects for each modality. Error bars denote 95% CI. The dotted lines are the lines of best fit.