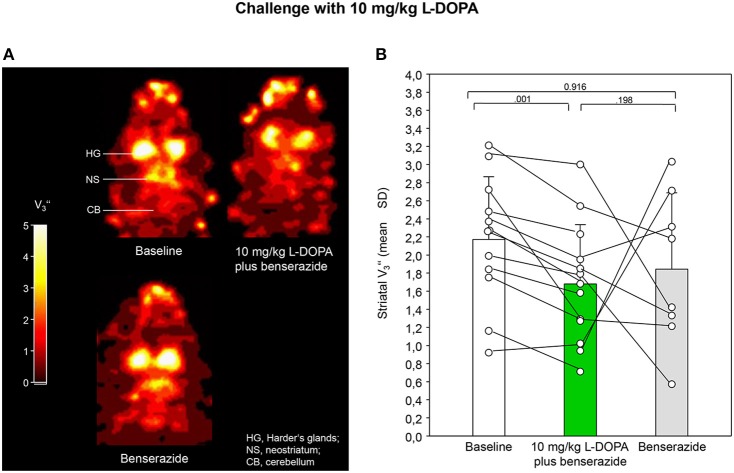
Figure 3.
(A) Coronal [123I]IBZM images of the samt rat in baseline and after challenge with 10 mg/kg L-DOPA/benserazide and benserazide alone. All images show V-values; it is understood, that the calculation of V is only valid for regions with specific radioligand binding such as the rat striatum. Calculations were performed using PMOD (version 3.5, PMOD Technologies Ltd., Zürich, Switzerland). (B) Striatal equilibrium ratios (V) in baseline and after challenge with 10 mg/kg L-DOPA/benserazide and benserazide alone. Rendered are means and standard deviations of the means. The circles represent the individual animals. For significant differences between conditions the respective p-values are given (two-tailed paired t-test, α = 0.0167 after Bonferroni correction).

