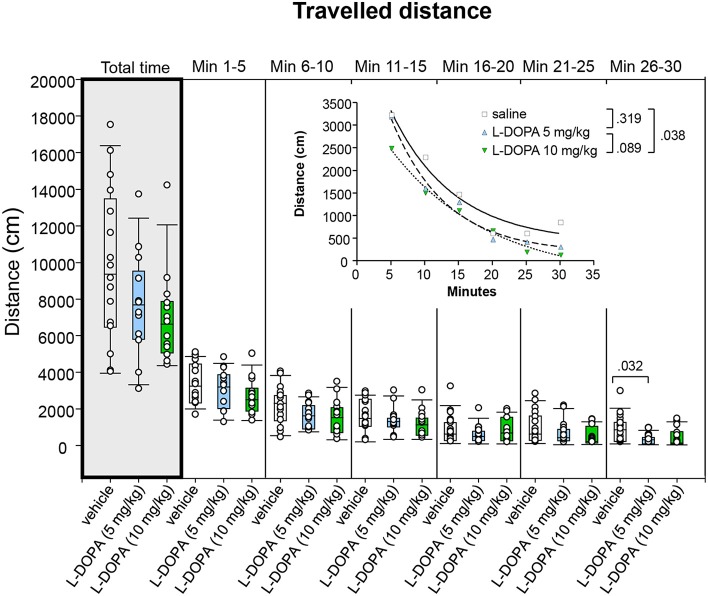
Figure 5.
Traveled distance (cm) after vehicle (0.9% saline), 5 and 10 mg/kg L-DOPA. The figure shows box and whisker plots of median distances traveled during the whole time of testing (gray shade) and in the individual 5-min time bins. 25-/75-percentiles are given in the boxes, while 5-/95-percentiles are represented by the whiskers. The circles represent the individual animals. For significant between-group differences the respective p-values are given (two-tailed Mann–Whitney U-test, α = 0.0167 after Bonferroni correction). Inset: t–b Curves obtained by plotting median values of traveled distances against time and fitting exponential functions [y(t) = a * exp (−K * x) + plateau with a, value at the time t; -K, rate constant; t, time] to these data. For the comparisons between groups (two-tailed F-test, α = 0.0167 after Bonferroni correction) the respective p-values are given).

