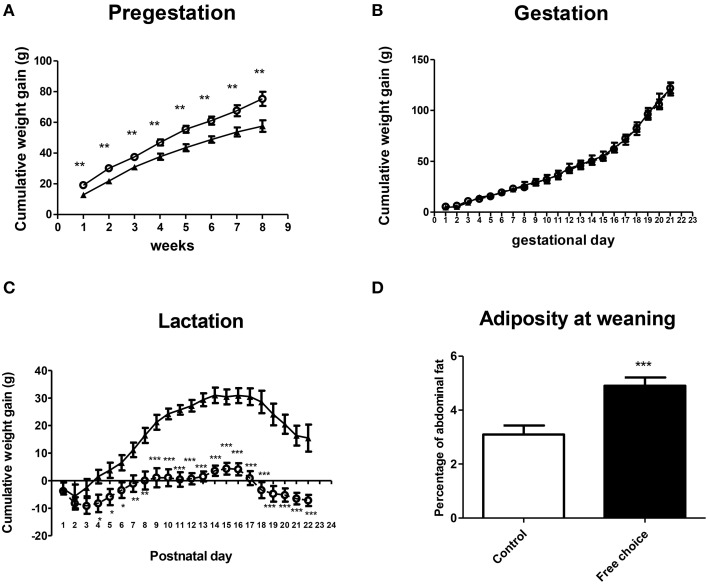
Figure 2.
Effect of diet on weight gain and adiposity of dams during perinatal period. Values are expressed as mean ± SEM. *p < 0.05, **p < 0.01, ***p < 0.001. Cumulative weight gain (g) of control (solid triangles) and free-choice (open circles) dams during pregestation (A), gestation (B), and lactation (C). Dams adiposity at weaning (D): control (open bars) vs. free-choice (solid bars) dams.

