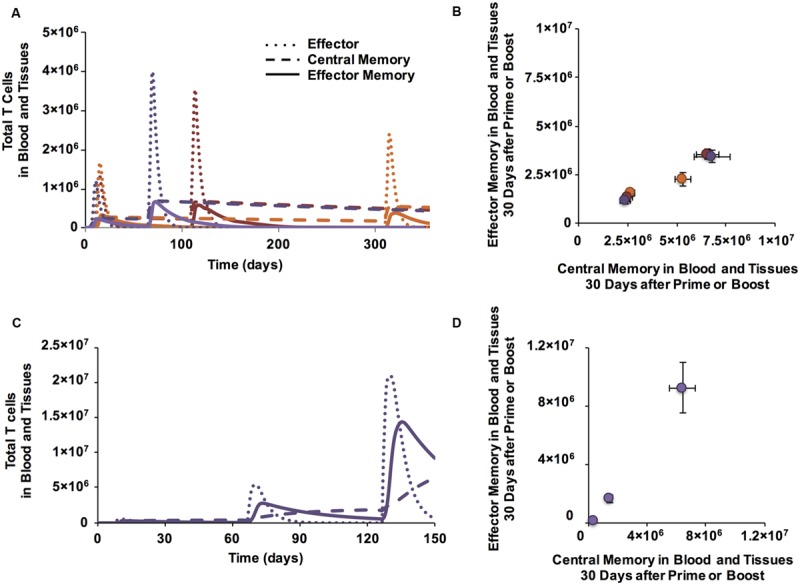
FIGURE 4.

Boosting increases the size of memory populations and can shift EM/CM ratios. (A) Time courses of CD4+ T cells in blood and peripheral tissues after prime and boost (purple: boost at day 60, red: boost at day 100, orange: boost at day 300). (B) Memory populations corresponding to time series from Panel A are plotted in Memory Design Space. CD4+ T cells in blood and peripheral tissues are counted at 30 days following each prime or boost. Error bars indicate SEM (n = 10). (C) Additional boosts increase number of CD8+ CM and EM T cells generated over time. (D) A second boost increases EM/CM ratio. Memory populations corresponding to time series from C and measured 30 days following a prime and two boosts are plotted in Memory Design Space. Error bars indicate SEM (n = 10). See Supplementary Figure S2 for analysis of change in skew.
