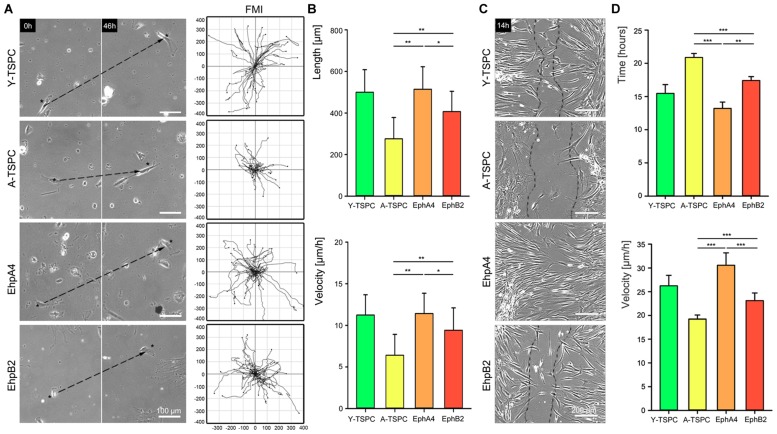
FIGURE 4.
Migration of EphA4-Fc and EphB2-Fc A-TSPC. (A) Representative images of random migration (dash lines show ecludian distance) and calculation of forward migration index (FMI). Bars = 100 μm. (B) Quantification of random migration (distance and velocity) (n = 9, total of 150 tracks per donor type). (C) Representative scratch assay of Y-TSCP, EphA4-Fc, EphB2-Fc, and control-Fc A-TSPC. Bars = 200 μm. (D) Estimation of scratch bridging time and cell velocity (n = 9, total of 36 scratches per donor type, ∗p < 0.05; ∗∗p < 0.01, ∗∗∗p < 0.001).

