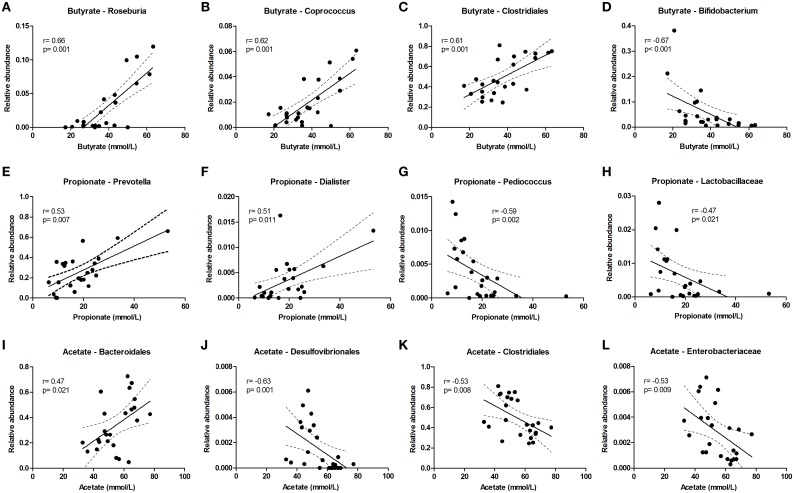
Figure 5.
Bacterial taxa that correlate with luminal acetate, butyrate, and propionate levels. The relative abundance (fraction of the total 16S rDNA; e.g., 0.01 = 1%) of bacterial taxa in all samples at 24 and 72 h (n = 24) (as determined by 16S rDNA pyrosequencing) was correlated with luminal butyrate (A–D), propionate (E–H), and acetate (I–L) levels in the same samples. Best fit lines with 95% confidence bands were generated by linear regression analysis. Spearman r- and p-value are displayed for each graph. This figure shows the taxa that correlated best, additional taxa are shown in Supplementary Figure 7.

