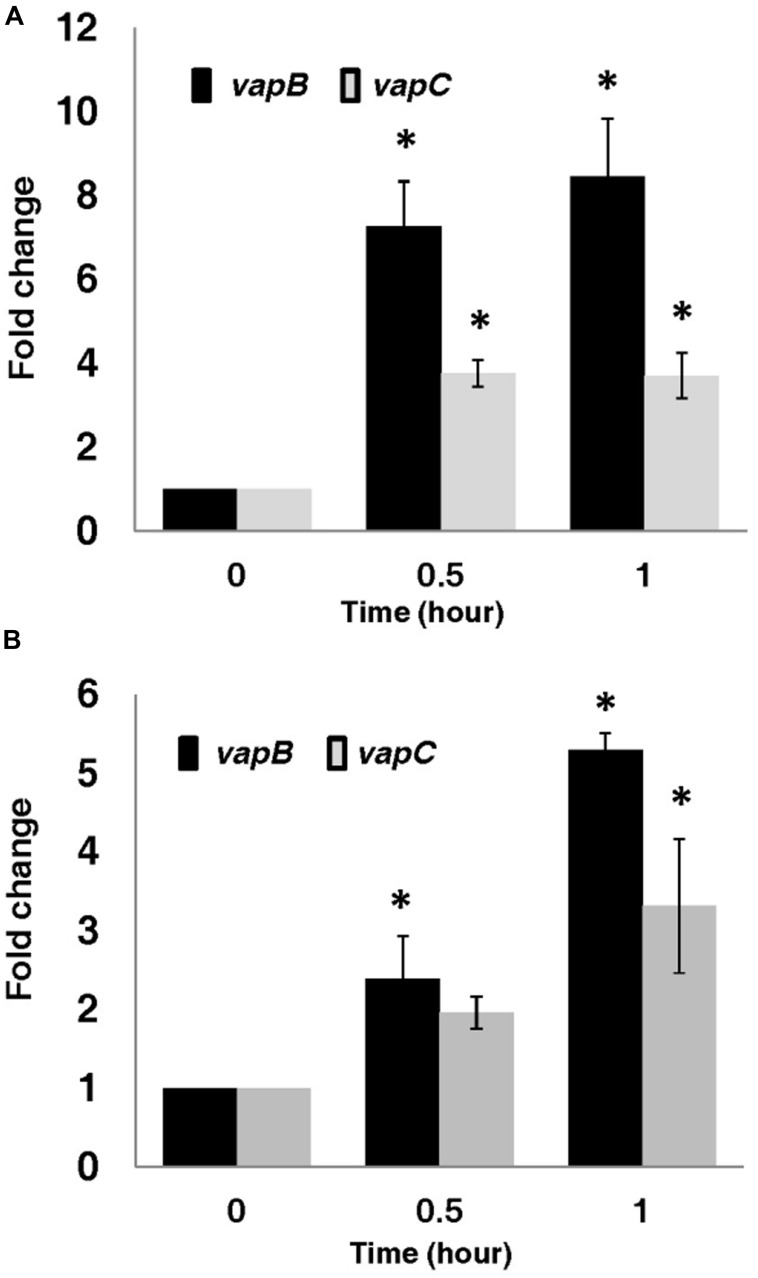
FIGURE 5.
Transcriptional activation of vapBC in A. citrulli 7a1 upon exposure to (A) antibiotic stress (12.5 μg/ml chloramphenicol) and (B) nutritional stress (1 mg/ml serine hydroxamate). Cells were grown in LB medium containing the above stressors, with constant shaking (150 rpm) at 28°C. Black bars, vapB; gray bars, vapC. Transcription levels of these genes were measured by Quantitative-Real Time-PCR (qRT-PCR). Results represent means and standard errors of six replicates per treatment per time point. Asterisks indicate significant differences (p ≤ 0.05) relative to time zero for each gene, according to ANOVA and the Dunnett’s post hoc test. Results from one experiment, out of three with similar results, are shown.

