FIGURE 5.
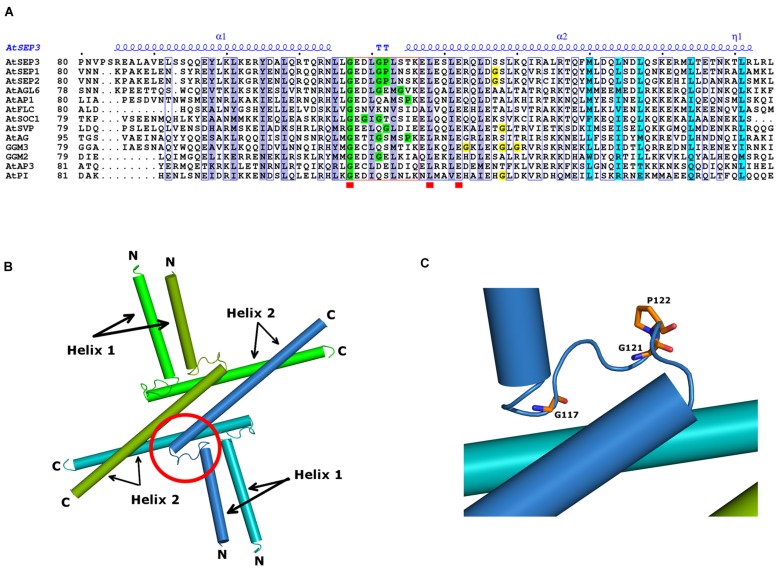
MADS TFs oligomerisation domain. (A) Sequence alignment spanning the SEP3 crystallographic structure (PDB 4OX0). All sequences are from A. thaliana SEP3, SEP1, SEP2, AP3, PI, AP1, AG, AGL6, SOC1, SVP, and FLC and the gymnosperm G. gnemon GGM2 and GGM3 proteins. Numbering is indicated at the start of the sequences and every tenth residue indicated by a black dot above the SEP3 sequence. Highly conserved regions are boxed in blue with a white background; strictly conserved residues are depicted by a red square below the sequence. The secondary structure elements of AtSEP3 K-domain (PDB 4OX0), are shown in blue above the sequences (α; TT; η). Residues involved in dimerisation and tetramerisation in SEP3 K-domain structure are highlighted in violet and cyan, respectively. The kink region between helices 1 and 2 is framed in red; Gly and Pro residues present within the kink regions are highlighted in green; Gly residues in the N-terminal region of helix 2 are highlighted in yellow. (B) Structure of SEP3 K-domain (PDB 4OX0). The oligomerisation domains of SEP3 are represented as cylinders; each monomer, composed of two distinct helices (helices 1 and 2), is colored uniquely in green, dark green, blue, and light blue. N and C-terminal regions are indicated. (C) Close-up of the SEP3 kink between helices. Glycine and proline residues are depicted as sticks colored by atom with carbons in orange.

