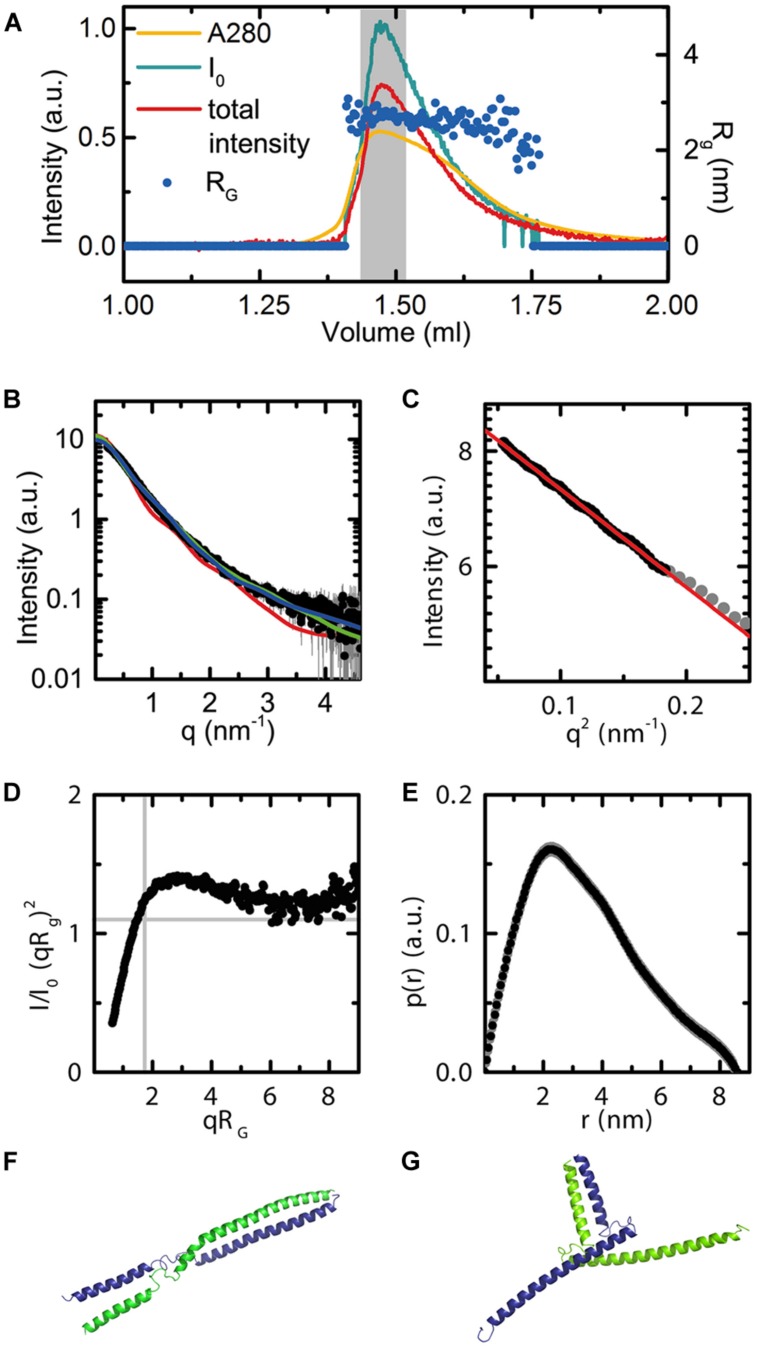
FIGURE 7.
Small angle X-ray scattering data for AG(74-173). (A) Experimental data showing the UV absorbance (yellow), X-ray scattering intensity (blue), and total intensity after buffer subtraction (red) for all collected frames. The radius of gyration across frames corresponding to the eluted peak are shown as dark blue dots (Rg = 2.7). The broad peak and slight variation in Rg corresponds to conformational flexibility of the protein in solution. The region of frames integrated for further analysis are highlighted in gray. Axes are as labeled. (B) Scattering curve in black for the integrated frames. CRYSOL fits for the bent and elongated dimer conformations, as well as the tetrameric SEP3 structure. Chi squared values were 5.6 for the elongated model (blue curve), 2.0 for the bent model (green curve) and 38.4 for the tetrameric model (red curve). (C) Close-up of the Guinier region. The linear fit demonstrates no evidence of aggregation of the protein. (D) Normalized Kratky plot calculated using the integrated frames. The shape of the curve is indicative of a flexible particle. (E) P(r) function. The calculated Porod volume for the particle is 36 nm3. Based on the Porod volume, the molecular mass of the particle is approximately 21 kDa. (F) Elongated homology model for AG(74-173). The homology model was based on the SEP3 K domain (4OX0) and secondary structure predictions for AG. Each monomer is depicted as a cartoon and colored blue and green. (G) Bent homology model for AG(74-173). Each monomer is depicted as a cartoon and colored blue and green. The homology models (F,G) were used for fitting the data using CRYSOL as shown in (B).

