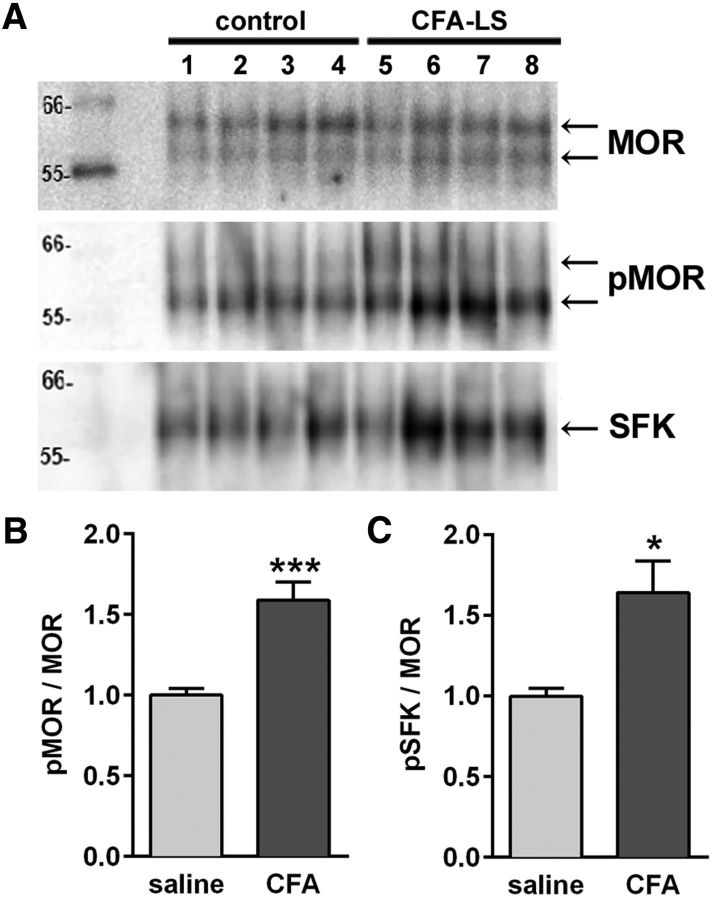
Figure 8.
Increased phosphorylation of MORs at Ser375 in latent sensitization. Rats were injected in one hindpaw with 50 μl of saline (n = 8) or CFA (n = 8). After 28 d, the rats were killed and the spinal cords collected. MORs were immunoprecipitated using a MOR antibody from Abcam (ab134054). A, Western blots were probed with antibodies to MOR (Neuromics, RA10104), p-Ser375-MOR (Neuromics RA18001, pMOR), and p-Tyr416-Src (Cell Signaling Technology, pSFK). Two bands at ∼57 and 64 kDa appear in the MOR and pMOR blots and one band at 60 kDa in the pSFK blot. Data are representative from four of eight rats in each group. B, The ratio of the optical density of the pSer375-MOR blot and the MOR blot was obtained and normalized to saline. C, The ratio of the optical density of the pSFK blot and the MOR blot was obtained and normalized to saline. *p = 0.0141, ***p = 0.0009, unpaired t tests with Welch's correction.

