
Figure 3.
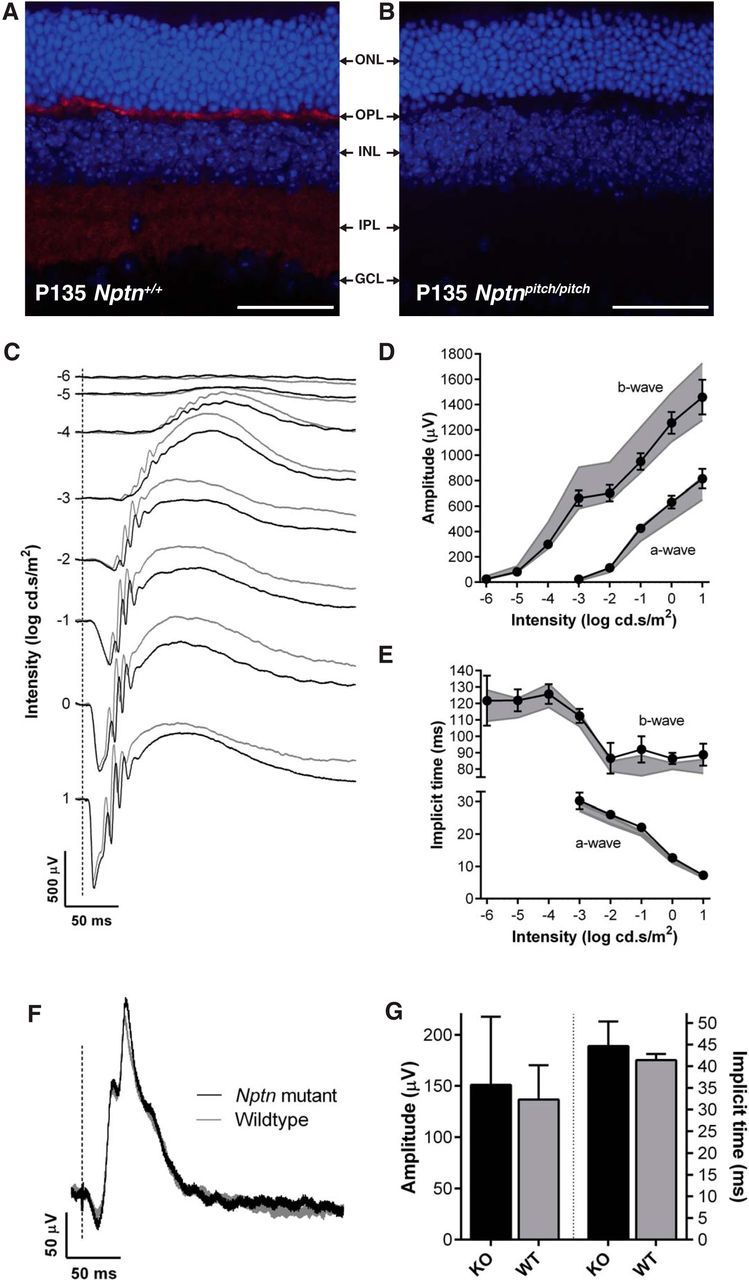
Neuroplastins are not required for retinal function. Retinal immunolabeling was undertaken using pitch mice, however, due to a strain-specific genetic anomaly of the eye in the C3H.Pde6b+ line, ERGs were recorded from Nptn−/− (n = 7) and Nptn+/+ (n = 7) mice, on a C57BL/6NTac genetic background, between 9 and 10 weeks of age. A, B, Np65 immunolabeling (red) of retinal cryosections from P135 Nptn+/+ (A) and Nptnpitch/pitch (B) mice, using DAPI as a nuclei stain. Scale bar, 50 μm. Although no gross retinal dysmorphology was observed in Nptnpitch/pitch mice, Np65 labeling was only observed in the plexiform layers of Nptn+/+ mice (OPL and IPL). C, Representative dark-adapted, flash ERG traces for Nptn−/− (black) and Nptn+/+ (gray) mice. Flash intensity increases from top to bottom and is indicated as log cd.s/m2 along left edge of responses. D, Quantification of the b-wave (left) and a-wave (bottom right) amplitudes across the stimulus intensity range. In this and the following panels, values from knock-out mice are shown as black circles/solid line (means ± 95% confidence limits); Nptn+/+ values are indicated as a gray area representing means ± 95% confidence limits. E, Quantification of the b-wave (left) and a-wave (bottom right) implicit times across the stimulus intensity range. Responses in both genotypes were intensity-dependent and not significantly different. F, Representative light-adapted, flash ERG traces from Nptn−/− and Nptn+/+ mice in response to 1 log cd.s/m2 stimulus. G, Quantification of the b-wave amplitudes (left) and implicit times (right) of light-adapted, flash ERG responses. Values from Nptn−/− (black) and Nptn+/+ (gray) are plotted as means (± 95% confidence limits as error bar) and were found not to be significantly different. ONL, Outer nuclear layer; OPL, outer plexiform layer; INL, inner nuclear layer; IPL, inner plexiform layer; GCL, ganglion cell layer.