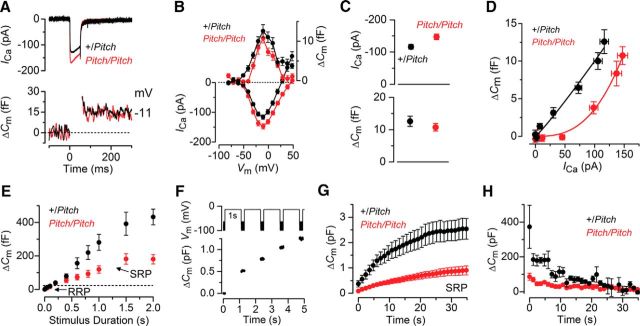
Figure 7.
Exocytosis does not fully mature in pitch IHCs. A, B, ICa and changes in ΔCm in adult control (P19) and pitch mutant (P21) IHCs. Recordings were obtained in response to 50 ms voltage steps from −81 mV in 10 mV increments. A, Only maximal responses are shown. C, Maximal peak ICa (top) and ΔCm (bottom) values for adult control and mutant IHCs. D, Synaptic transfer curves obtained by plotting ΔCm against the corresponding ICa between −71 mV and −11 mV (Johnson et al., 2010, 2013). Fits are according to a power function: ΔCm = cICaN where c is a scaling coefficient and the exponent N is the power. Mutant IHCs show a steeper intrinsic Ca2+ dependence than control cells. E, Average ΔCm from seven control and nine mutant IHCs (P16-P22) in response to voltage steps from 2 ms to 2 s (to ∼−11 mV) showing the RRP and SRP. F, ΔCm elicited using repetitive voltage steps to −11 mV of 1 s in duration to elicit the SRP. The interstep interval was 200 ms. For clarity, only the first few steps are shown. The voltage protocol used is shown above the traces. G, Average cumulative ΔCm values obtained in response to the 1 s (35 step) protocol, from four control and six mutant IHCs. H, Individual ΔCm values from control and mutant IHCs measured following each voltage step from G.

