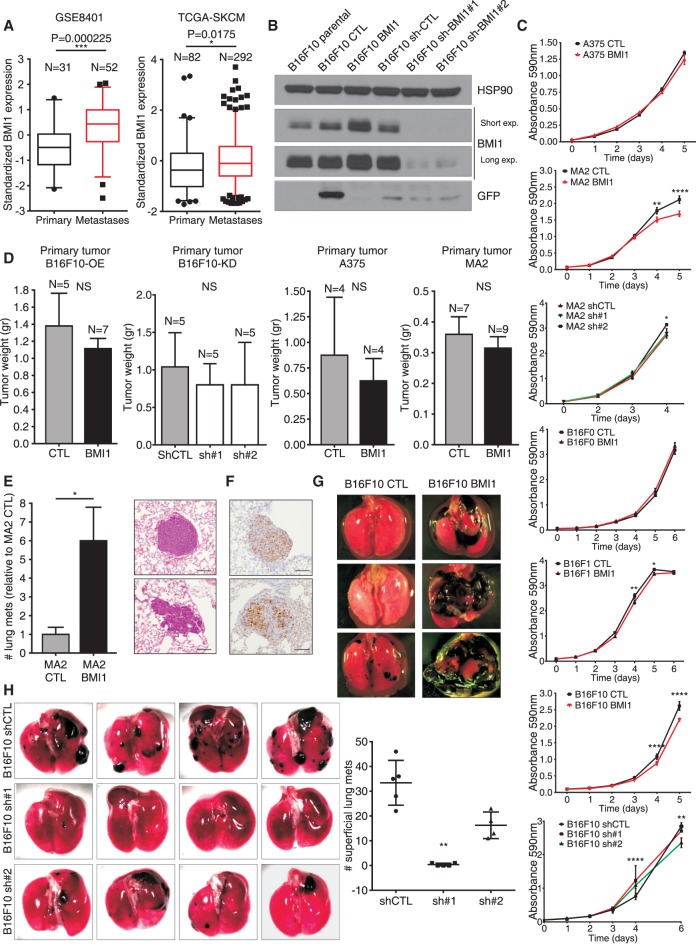
Figure 1.
BMI1 promotes metastatic potential of melanoma cells. (A) Box and whisker plots (fifth to 95th percentile) show BMI1 expression in metastatic versus primary melanoma samples (GSE8401 and TCGA-SKCM data sets). (B) Western blotting showing GFP, BMI1, and HSP90 loading control [CTL] in B16F10 variants. (C) In vitro growth curves of the indicated cell variants. P-values were calculated by two-way ANOVA with Sidak correction. (D) Primary tumor weight after subcutaneous injection of B16F10, A375, and MA2 CTL and variant cells. (E) Relative number of lung metastases (normalized to CTL) resulting from tail vein injection of CTL or BMI1 MA2 cells. (E,F) Representative images of H&E-stained (E) and anti-Ki67-stained (F) sections. Bars, 100 µm. (G,H) Representative images of lungs showing superficial metastasis after tail vein injections with CTL or BMI1 B16F10 cells (G) or sh-CTL versus sh-BMI1 (#1 or #2) B16F10 (H) cells with quantification. For H, statistical significance was assayed by one-way ANOVA and Kruskal-Wallis test. See also Supplemental Figure S1.

