Figure 7.
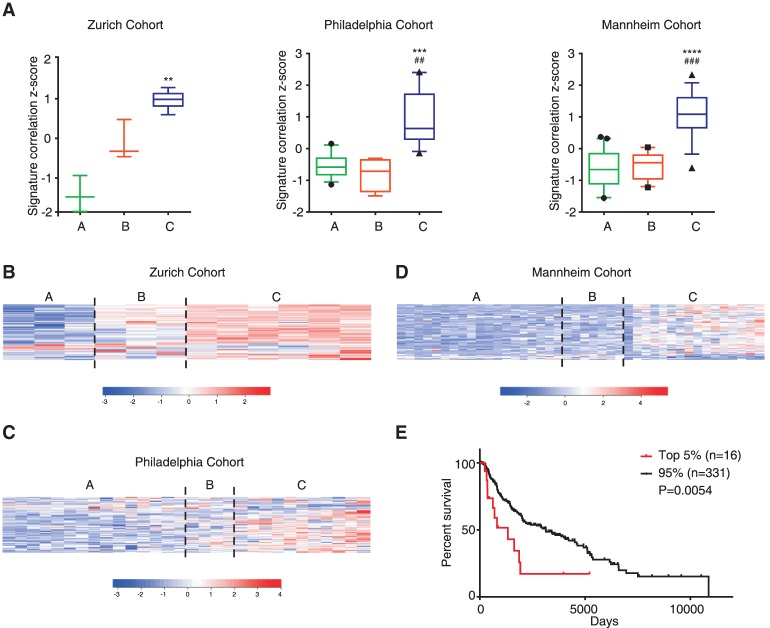
BMI1-induced signature correlates with invasiveness and clinical outcome of human melanoma. (A) Standardized BMI1 RNA-seq signature correlation scores in the weakly invasive A , intermediate invasive B, and highly invasive C subclasses of melanoma within the Zurich, Philadelphia, and Mannheim cohorts. Data are presented as box plots (10th to 90th percentile), with P-values calculated by Dunn's test following a significant Kruskal-Wallis test. (*) P-values for the C versus A subclasses; (#) P-values for the C versus B subclasses. (B–D) Heat maps show expression of BMI1 DE genes with a fold change greater than two between the A+B versus C subclasses and common to at least two data sets. (E) Patient outcome based on BMI1-induced signature correlation (top 5% vs. the remaining 95%) using the TCGA-SKCM data set. Log rank P-value is shown. See also Supplemental Figure S7.

