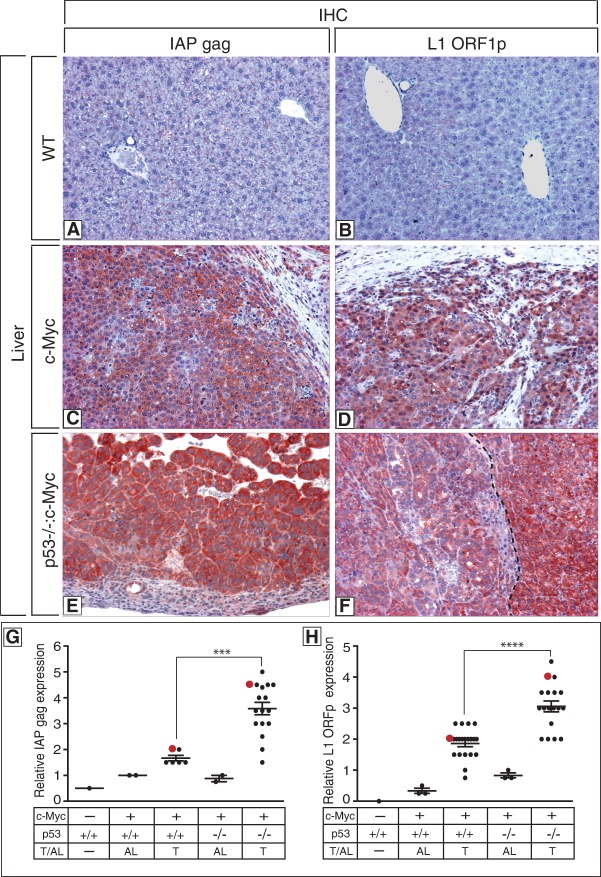
Figure 7.
Elevated retrotransposon expression in mouse tumors lacking p53. (A–F) Photomicrographs of livers from a wild-type (A,B), a c-Myc-expressing (C,D), and a p53-null c-Myc-expressing (E,F) mouse depicting elevated expression of mouse IAP gag (red staining; left panels) (Dewannieux et al. 2004) and mouse L1 ORF1p (red staining; right panels) (Soper et al. 2008) in tumors (C–F). The dotted line in F denotes the boundary between a tumor with modest expression of L1 ORF1p (left) and one expressing high levels of L1 ORF1p (right). Original magnifications, ×125. Specificity controls for antibody stainings are shown in Supplemental Figure 12 for IAP gag and L1 ORF1p. (G,H) Graphs showing quantitation of relative levels of IAP gag and L1 ORF1p in the wild-type liver, adjacent liver (AL), and liver tumors (T) in p53+/+:Myc and p53−/−:Myc mice. Quantitation was performed as described in the Materials and Methods and in Comerford et al. (2014). Red dots in G and H correspond to immunohistochemistry images in C–F. In F, two distinct tumors are shown, and the matching red dot in H corresponds to the highest-expressing tumor at the right. The intensity of staining of IAP gag (G) and L1 ORF1p (H) in Myc-driven tumors in p53-null mice is significantly different from Myc-driven tumors in p53 wild-type mice, denoted by asterisks (P-value < 0.0001) (see the Materials and Methods).

