Fig. 1.
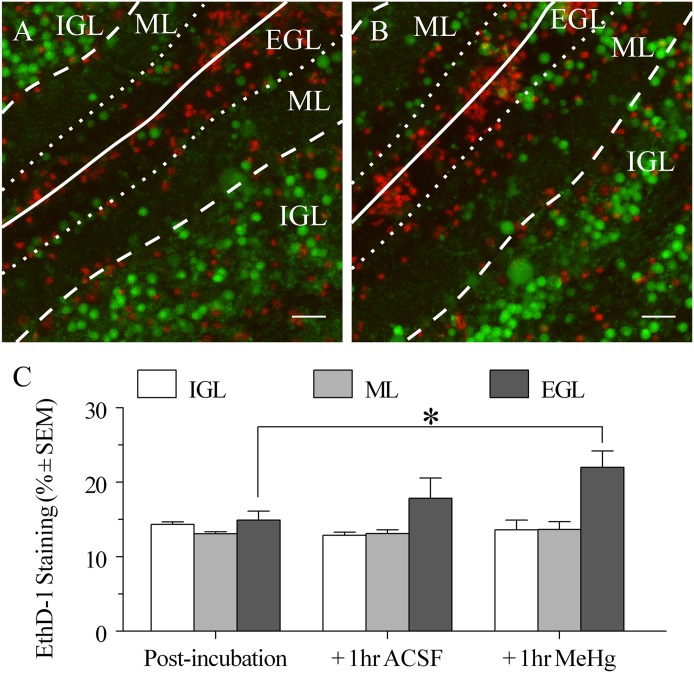
(A) Representative pseudocolor fluorescent image of an acutely isolated cerebellar slice from PND9 rat showing modified fluo4/ethD-1 live/dead cytotoxicity assay, postincubation control. Images are from internal folds of the developing cerebellum. Images show maximum fluo4 and ethD-1 fluorescence values by pixel. The approximate pial surface of an inner fold is indicated by a white line, and other boundaries are indicated by dashed lines. EthD-1 (red), an indicator of dead cells, and Fluo4 AM (green), an indicator of relative intracellular calcium concentration, do not colocalize. Scale bar represents 30 μm. (B) Representative image from separate slice from the same cerebellum after 1 additional hour in ACSF supplemented with 20 μM MeHg. (C) EthD-1 mean pixel staining (% pixels ± S.E.M.) comparison of layers postincubation in fluo4 and ethD-1 (n = 5), with an additional 1 hour of incubation in ACSF (n = 3) or with an additional 1 hour of incubation in 20 μM MeHg ACSF (n = 3).

