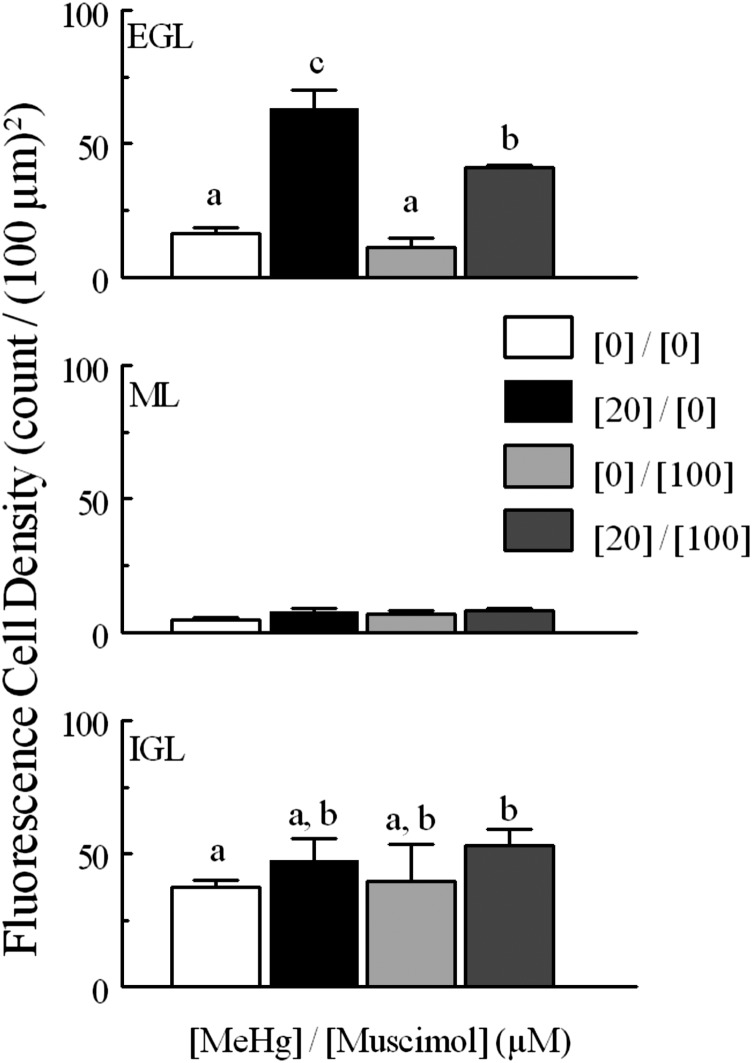
Fig. 10.
Percentage of “extinguished” cells in experiments comparing MeHg and bicuculline treatment. Comparisons were made between 20 and 0 μM MeHg treatments, between bicuculline alone and 0 μM MeHg, between bicuculline alone and bicuculline combined with 20 μM MeHg, and between bicuculline combined with MeHg or MeHg alone. Values are mean ± S.E.M., for the same n as described in Fig. 6.

