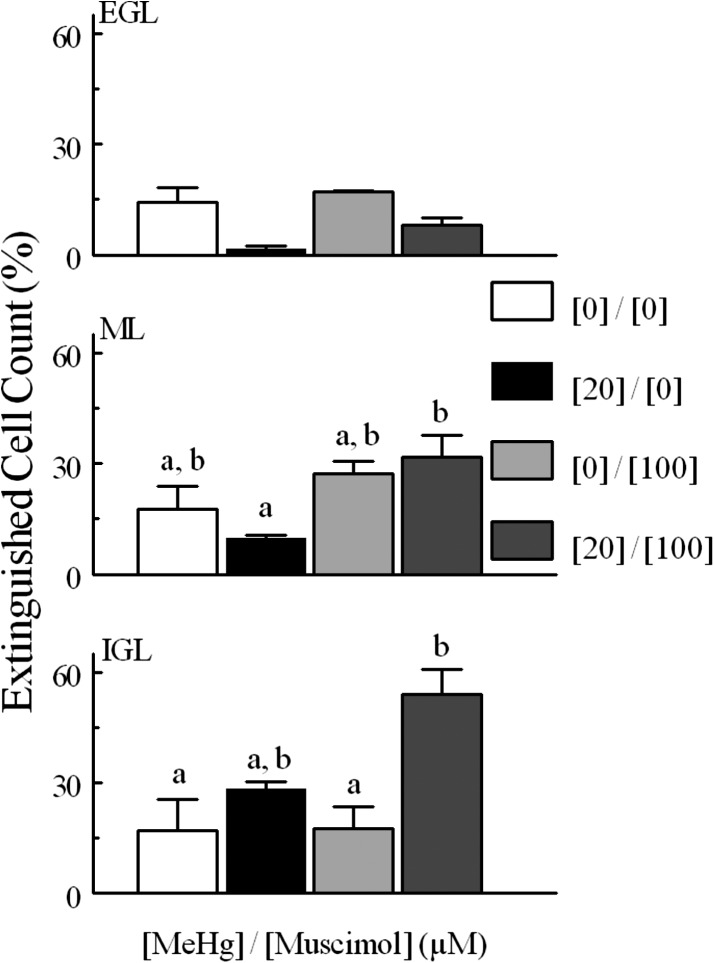
Fig. 11.
Percentage of “extinguished” cells in experiments comparing MeHg and muscimol treatment. Comparisons were made between 20 and 0 μM MeHg treatments, between muscimol alone and 0 μM MeHg, between muscimol alone and muscimol combined with 20 μM MeHg, and between muscimol combined with MeHg and 20 μM alone. Significantly different pairs within each layer are indicated by nonoverlapping letters (P < 0.05). Values are mean ± S.E.M. with n the same as described in Fig. 7.

