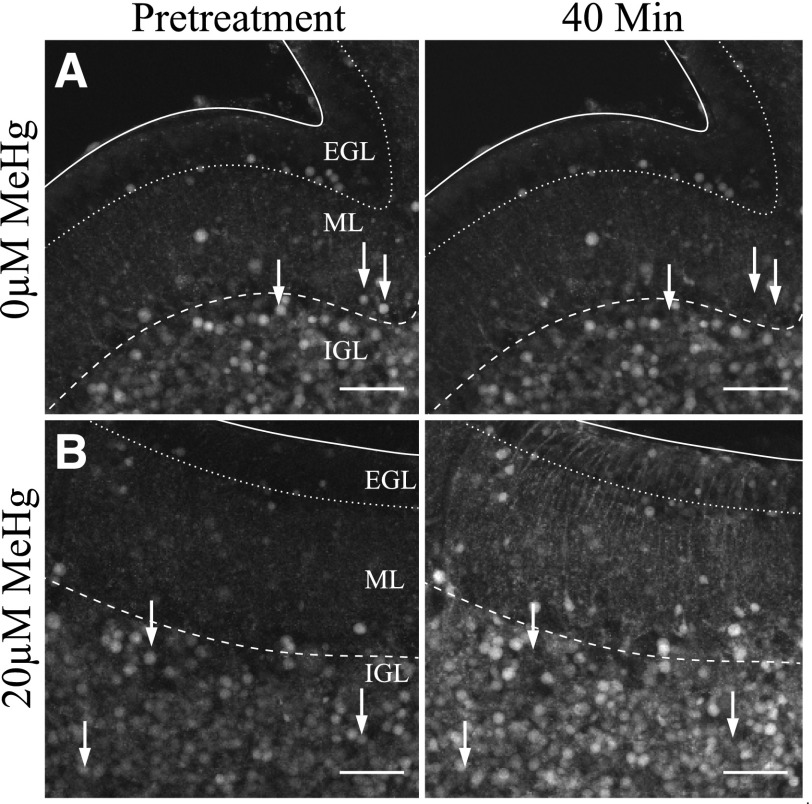
Fig. 2.
Grayscale 40× magnification examples of cerebellar slices before (−10) and after (40 minutes) treatment with MeHg. Images show projection of maximum fluo4 fluorescence by pixel. (A) Fluorescence does not change over the course of imaging in control slices. (B) MeHg increased fluorescence in all layers, with the signal from many cells saturating the detector. Scale bars are 60 μm in all images. Surfaces and boundaries are indicated as with Fig. 1. White arrows indicate examples of cells with extinguished fluorescence by the end of treatment.

