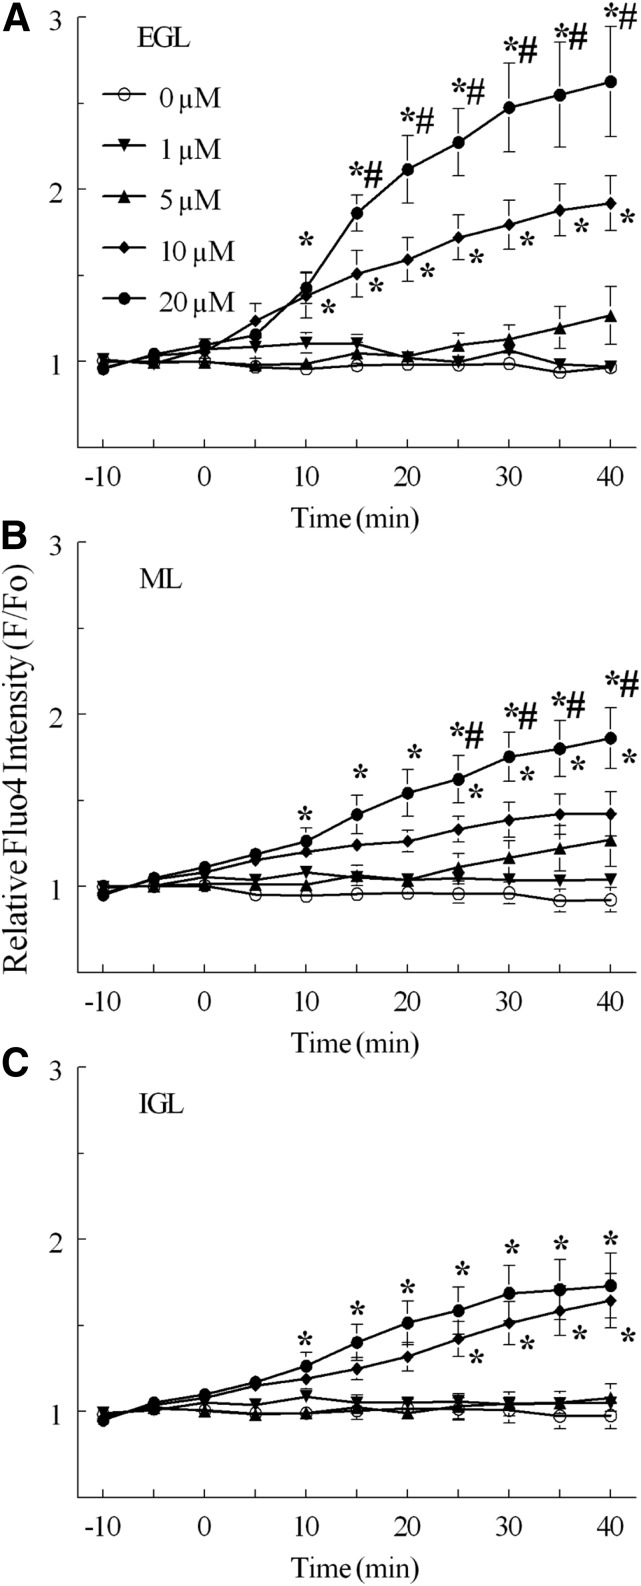
Fig. 3.
Relative fluo4 fluorescence intensity (F/F0) in CGCs by histologic layer in slices from neonatal rat cerebellum exposed to concentrations of MeHg continuously for 30 minutes. Continuous perfusion of ACSF with 0 μM (°, n = 5), 1 μM (▾, n = 3), 5 μM (▴, n = 5), 10 μM (♦, n = 6), or 20 M MeHg (●, n = 4) were compared in (A) the EGL, (B) the ML, and (C) the IGL. Significant differences are indicated from untreated control (*) and between 20 μM and 10 μM treatments (#) at the same time point. Intensity values are expressed in arbitrary units (mean ± S.E.M.).

