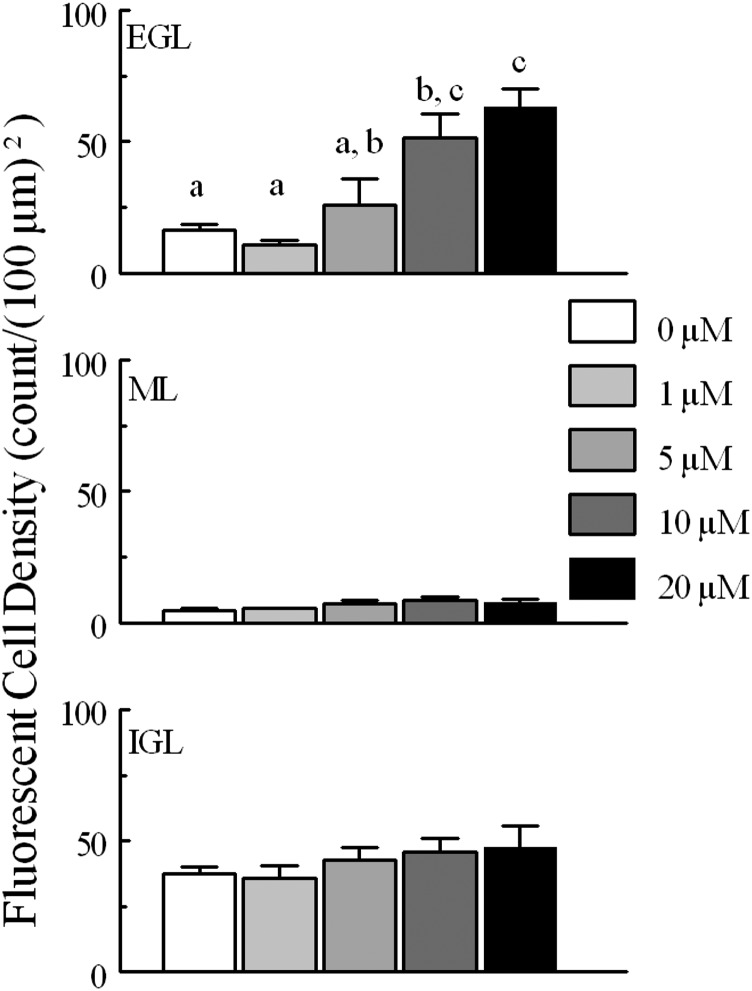
Fig. 4.
Cell density per (100 μm)2 for CGCs monitored for fluo4 fluorescence intensity in each layer (EGL, ML, and IGL) for tissue treated with different concentrations of MeHg. Fluorescent CGCs were more dense in the EGL and IGL layers than in the ML. At higher MeHg concentrations, fluorescent CGCs in the EGL were more dense than in IGL; at lower concentrations, density was higher in the IGL. Within the EGL, fluorescent cell density increased significantly with greater concentrations of continuous MeHg treatment; nonoverlapping letters are statistically significant different comparisons (P < 0.05). Paired comparisons were made between each concentration of MeHg by layer. Significantly different pairs within each layer are indicated by different letters (P < 0.05). N for each treatment is the same as in Fig. 3.

