Fig. 1.
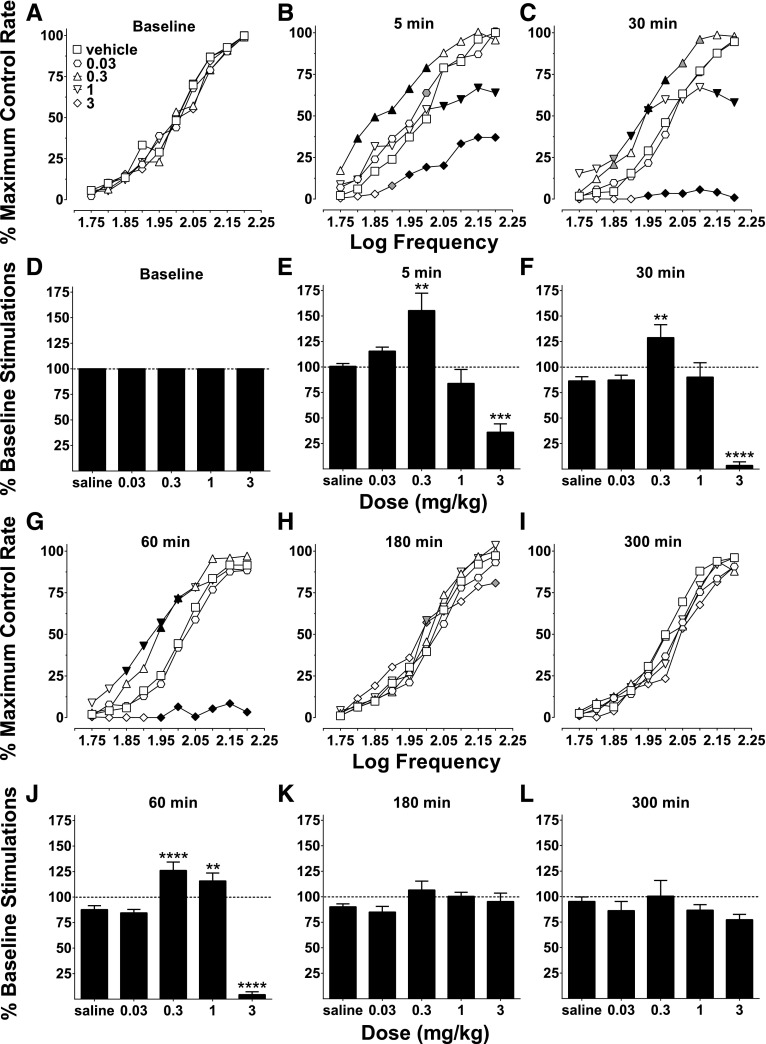
Oxycodone dose- and time-dependent effects on ICSS. Frequency-rate response curves (A–C and G–I) and percent baseline stimulations (D–F and J–L) for the effects of oxycodone with vehicle (saline) at multiple time points (baseline, 5, 30, 60, 180, and 300 minutes). (A) There were no differences between baseline frequency-rate response curves for any dose, as there was no effect of baseline day (F4, 28 = 2.18, P = 0.10) or an interaction between treatment baselines and frequency (F36, 252 = 1.21, P = 0.21). (B) Frequency-rate analysis at 5 minutes showed a main effect of oxycodone dose (F4, 28 = 23.75, P < 0.0001) and an interaction between dose and frequency (F36, 252 = 5.37, P < 0.0001). (C) At 30 minutes, there was a main effect of dose (F4, 28 = 30.16, P < 0.0001) and an interaction between dose and frequency (F36, 252 = 12.44, P < 0.0001). (D) Percent baseline responding was used to normalize baselines for each dose. (E) Percent baseline stimulation analysis showed differential effects of oxycodone at 5 minutes (F4, 28 = 20.42, P < 0.0001). (F) Percent baseline stimulation analysis also showed effects of oxycodone at 30 minutes (F4, 28 = 28.56, P < 0.0001). (G) At 60 minutes, there was a main effect of dose (F4, 28 = 64.11, P < 0.0001) and an interaction between dose and frequency (F36, 252 = 10.83, P < 0.0001). (H) At 180 minutes, there was no main effect of dose (F4, 28 = 1.15, P = 0.35), but there was an interaction between dose and frequency (F36, 252 = 1.85, P < 0.01). (I) At 300 minutes, there was no effect of dose (F4, 28 = 1.15, P = 0.35) or an interaction between dose and frequency (F36, 252 = 0.88, P = 0.66). (J) There was also an effect on percent baseline stimulations at 60 minutes (F4, 28 = 84.67, P < 0.0001). (K) There was no effect on percent baseline stimulations at 180 minutes (F4, 28 = 1.81, P = 0.15). (L) There were also no effects on percent baseline stimulations at 300 minutes (F4, 28 = 1.23, P = 0.32). Frequency-rate response values represent the mean normalized response rate (percent of maximum control responding) across 10 frequency presentations (1.75–2.20 log/Hz). Percent baseline stimulations represent the total number of responses across all test frequency presentations expressed as a percentage of each individual subject’s total baseline responses. All values represent mean ± S.E.M. (error bars excluded from frequency-rate panels) of eight rats. For frequency-rate panels, significant differences compared with vehicle at the respective frequencies are denoted by filled symbols (gray: P < 0.05; black: P < 0.01). Significant differences for percent baseline stimulations panels are denoted by asterisks (**P < 0.01; ***P < 0.001; ****P < 0.0001).

