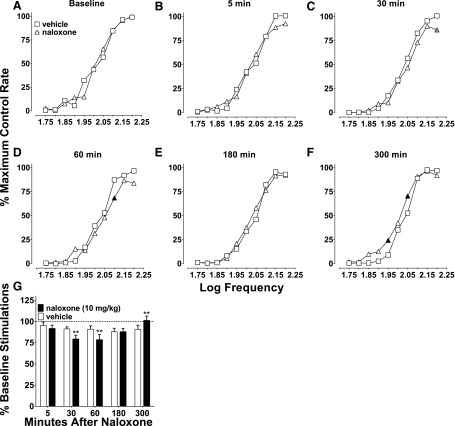
Fig. 5.
Effects of naloxone (10 mg/kg) over time (5–300 minutes). (A) There were no differences between vehicle (saline) and naloxone (10 mg/kg) baseline responding, because there was no main effect of treatment (F1, 7 = 0.00, P = 0.99) and no interaction between treatment and frequency (F9, 63 = 1.78, P = 0.09). (B) At 5 minutes, there was no effect of naloxone (F1, 7 = 0.19, P = 0.18), and there was an interaction between naloxone treatment and frequency (F9, 63 = 2.09, P < 0.05); however, post hoc tests showed no differences at any frequency. (C) At 30 minutes, there was a main effect of naloxone (F1, 7 = 8.51, P < 0.05) and an interaction (F9, 63 = 2.07, P < 0.05). (D) 60 minutes after administration, there was a main effect of naloxone treatment (F1, 7 = 6.72, P < 0.05) and an interaction between treatment and frequency (F9, 63 = 3.65, P < 0.01). (E) At 180 minutes, there was no effect of naloxone (F1, 7 = 0.76, P = 0.41) and no interaction between naloxone and frequency (F9, 63 = 1.24, P = 0.29). (F) At 300 minutes, there was an effect of naloxone treatment (F1, 7 = 10.52, P < 0.05) and an interaction between treatment and frequency (F9, 63 = 2.82, P < 0.01). (G) Percent baseline stimulations from the same data set. There was a main effect of time point (F4, 28 = 3.47, P < 0.05) and no main effect of naloxone treatment (F1, 7 = 0.57, P = 0.47); however, there was an interaction between time point and naloxone treatment (F4, 28 = 6.78, P < 0.001). Significant differences for frequency-rate curves (A–F) are denoted by filled symbols (gray: P < 0.05; black: P < 0.01) and by asterisks for the percent baseline stimulations (G; **P < 0.01). All values represent means ± S.E.M., and error bars on frequency-rate curves are omitted for clarity (n = 8).

