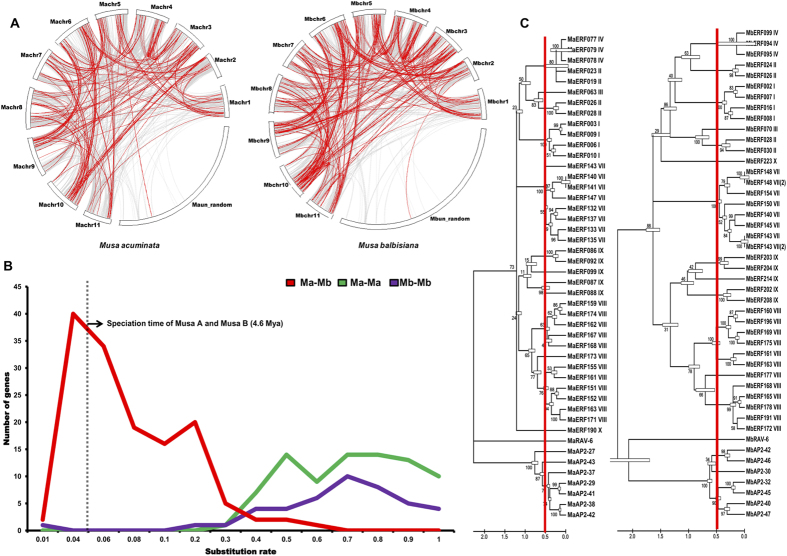
Figure 2. Synteny conservation of duplicated AP2/ERF genes and speciation of ERF gene in Musa genomes.
(A) Dark red lines indicate duplicate ERF genes and Grey lines indicate collinear blocks within the A and B genome. (B) Red line indicates the substitution rate of ortholog ERF genes between the A and B genome. Vertical grey bar indicates speciation tine between the genome (4.6 million years ago). Green and Purple lines indicate the duplication event of ERF genes in A and B genome respectively. (C) Phylogenetic tree of diverged ERF genes involved in ripening process. Branch length in each phylogenetic tree is proportional to the synonymous substitution rate. The vertical red line bar in each phylogenetic tree indicates speciation time. Right and left trees show duplication event in A and B genomes, respectively.

