
Figure 5.
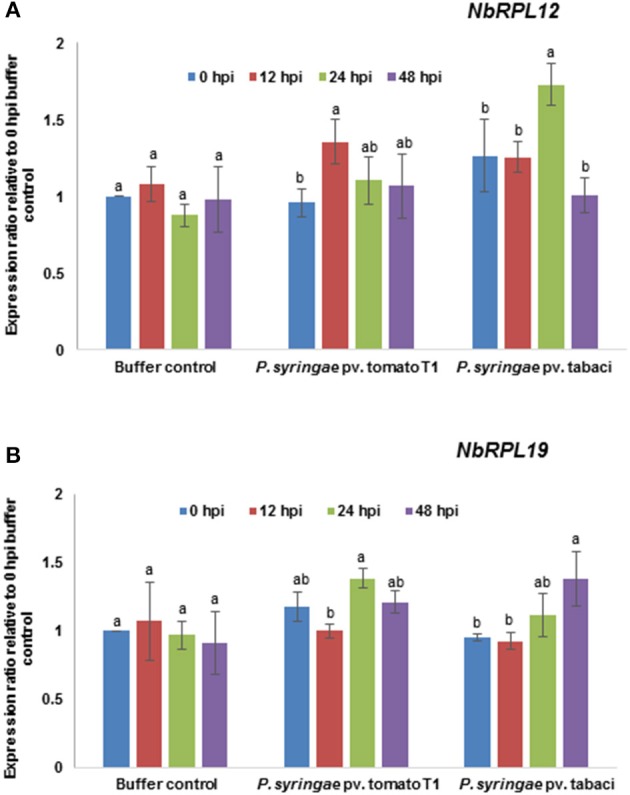
Transcript expression pattern of NbRPL12 and NbRPL19 in wild-type N. benthamiana leaves challenged with host or nonhost pathogen. N. benthamiana leaves were syringe inoculated with nonhost pathogen P. syringae pv. tomato T1 (P. s. tomato T1; OD600 = 0.0002) or host pathogen P. syringae pv. tabaci (P. s. tabaci; OD600 = 0.0001). The transcript levels of NbRPL12 (A) and NbRPL19 (B) genes were measured at indicated time points post inoculation by real-time quantitative RT-PCR. Data points are average of three biological replicates and error bars indicate the standard deviation. Different letters above the bar indicate a significant difference from Two-way ANOVA at p < 0.05 with Tukey's HSD means separation test (α = 0.05) among different time points within a treatment. Buffer control indicates leaves infiltrated with water. See Supplementary Table S2 for details about statistics.