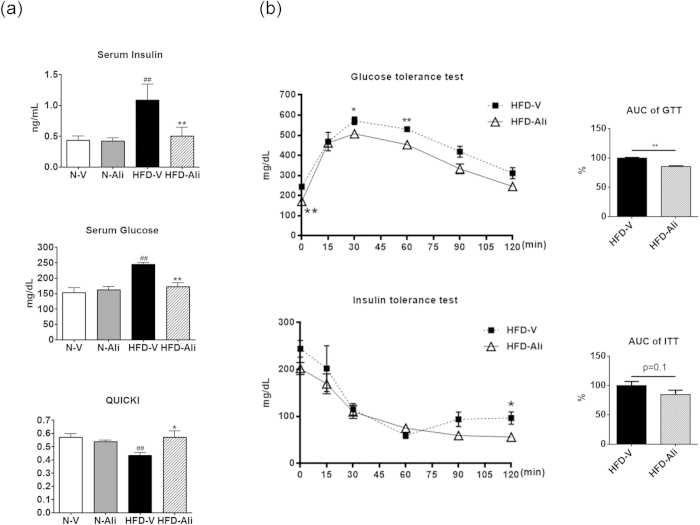
Figure 2. Aliskiren improved insulin sensitivity in the mice fed with a high fat diet.
(a) The levels of insulin and glucose in serum and quantitative insulin sensitivity check index (QUICKI), a measurement of insulin sensitivity derived from the formula 1/(log insulin.glucose) from all groups. N-V: mice fed with a normal diet (n = 6); N-Ali: mice fed with a normal diet and treated with aliskiren (n = 6); HFD-V: mice fed with a high fat diet; HFD-Ali (n = 7): mice fed with a high fat diet and treated with aliskiren (n = 7). (b) Glucose tolerance test (GTT) and insulin tolerance test (IGG) in a set of HFD-V and HFD-Ali mice (n = 4 in each group). The area of the blood glucose response profile curve from each mouse is summed to obtain the area under the curve (AUC). The relative area values of the HFD-Ali group are expressed as a percentage relative to the average AUC of the HFD-V group, which is defined as 100%. ##P < 0.01 vs. N-V; *P < 0.05 vs. HFD-V; **P < 0.01 vs. HFD-V group.

