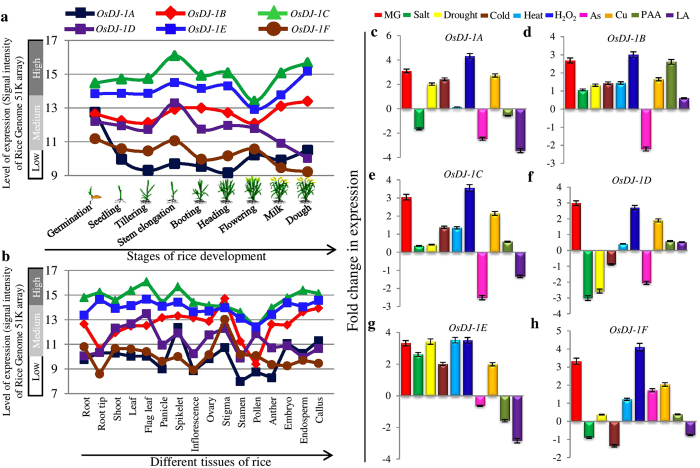
Figure 5. Expression profiling of OsDJ-1 genes under different developmental stages, various tissues and multiple abiotic and biotic stresses.
Expression was analyzed at nine distinct developmental stages (a) and sixteen tissues (b) of rice, as shown at the X-axis of the diagram. The mean signal intensity values from Affymetrix 51 K array were collected from genevestigator and plotted in the diagram. Color bar at the top of the figure represents the gene name. Expression of OsDJ-1 genes was further analyzed under different stress conditions by qRT-PCR. Bar graphs (c–h) depict fold change in expression of OsDJ-1 genes under different stress conditions – salt, cold, drought, heat, H2O2, MG, As, Cu, PAA and LA. For expression analysis by qRT-PCR, 10 day old seedlings of IR64 variety (a moderately salt-sensitive cultivar) of rice were subjected to stress treatment for 8 hrs followed by RNA isolation, first strand cDNA synthesis and real-time PCR. Error bars showed standard deviation of three biological replicates.

