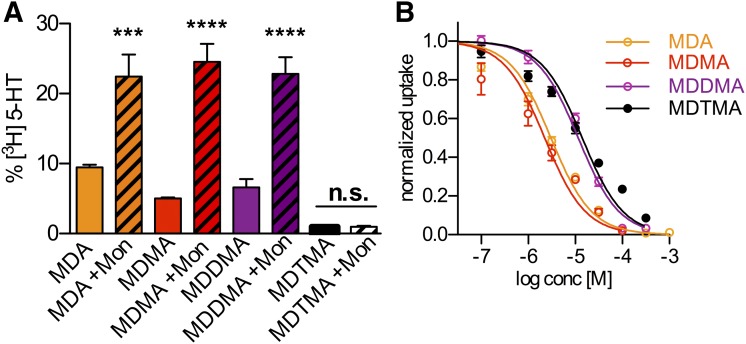
Fig. 3.
(A) Nonexocytotic [H3]5-HT release from HEK293 cells stably transfected with SERT induced by MDA (10 µM), MDMA (3 µM), MDDMA (30 µM), and MDTMA (30 µM), with and without monensin (Mon). The respective values are MDA (9.46 ± 0.99%; n = 6), MDA + Mon (22.44 ± 7.71%; n = 6), MDMA (5.02 ± 0.33%; n = 4), MDMA + Mon (24.52 ± 5.81%; n = 5), MDDMA (6.63 ± 4.14%; n = 12), MDDMA + Mon (22.81 ± 8.00%; n = 11), MDTMA (0.98 ± 0.45%; n = 9), and MDTMA + Mon (0.98 ± 0.44%; n = 9). ***P < 0.001 and ****P < 0.0001, one-way analysis of variance with Bonferroni’s multiple comparison test. (B) Inhibition of [H3]5-HT uptake by MDA, MDMA, MDDMA, and MDTMA as a function of concentration measured in HEK293 cells stably transfected with SERT. The IC50 values for MDA, MDMA, MDDMA, and MDTMA are 3.04 µM (2.67–3.45 µM), 2.24 µM (1.71–2.93 µM), 11.56 µM (10.02–13.17 µM), and 14.06 µM (11.95–16.53 µM), respectively.

