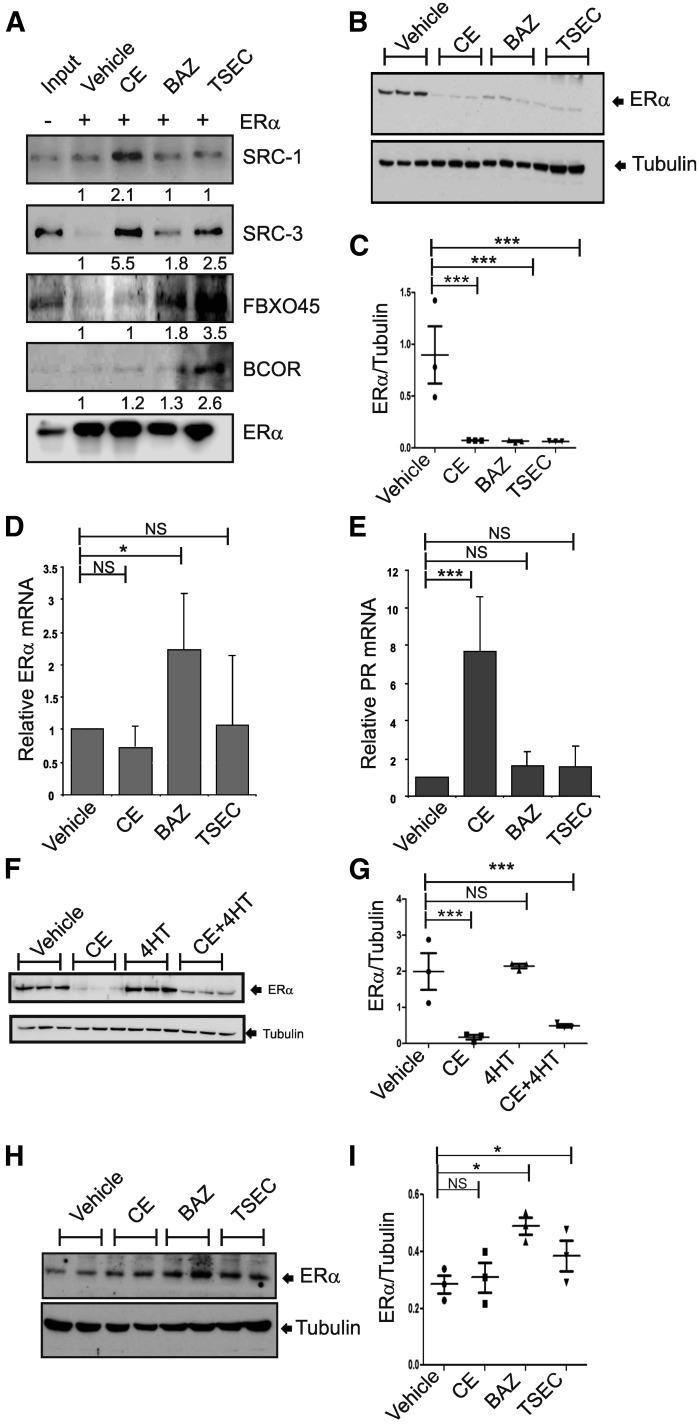
Fig. 3.
TSEC causes ERα protein degradation in human breast cancer cells to inhibit ERα activity. (A) ERα/ERE-DNA pull-down analyses were performed using MCF7 nuclear extracts in the presence of vehicle, CE (10 nM), BAZ (100 nM), and TSEC (10 nM CE plus 100 nM BAZ). After ERα/ERE-DNA pull-down analyses, the levels of SRC-1, SRC-3, FBXO45, BCOR, and ERα in the precipitates were determined by Western blotting analyses. (B) MCF7 cells were treated with vehicle, CE (10 nM), BAZ (100 nM), and TSEC (10 nM CE and 100 nM BAZ) for 24 hours. Subsequently, the ERα and tubulin protein levels in MCF7 cells were determined by Western blotting analyses (n = 3/group). (C) The ratios of ERα to tubulin in the MCF7 cells in (B) are shown in a graph (n = 3/group). (D) The total RNA was isolated from the MCF7 cells in (B), and the levels of ERα mRNA and 18S rRNA were determined by real-time reverse-transcription polymerase chain reaction analyses. The ERα mRNA levels in each group were normalized to the 18S rRNA levels. The normalized ERα mRNA levels in hormone-treated MCF7 cells relative to vehicle-treated MCF7 cells are shown in a graph (n = 3/group). (E) PR mRNA levels were determined in the MCF7 cells described in (B) and normalized to the 18S rRNA levels. The normalized PR mRNA levels in hormone-treated MCF7 cells relative to vehicle-treated MCF7 cells are shown in a graph (n = 3/group). (F) MCF7 cells were treated with vehicle, CE (10 nM), 4-hydroxytamoxifen (4-HT; 100 nM), and CE (10 nM) plus 4-HT (100 nM) for 24 hours. Subsequently, the ERα and tubulin protein levels were determined by Western blotting analyses (n = 3/group). (G) The ratio of ERα to tubulin in (F) is shown in a graph. (H) HTB-85 cells were treated with vehicle, CE (10 nM), BAZ (100 nM), and TSEC (10 nM CE plus 100 nM BAZ) for 24 hours. Subsequently, the ERα and tubulin protein levels in HTB-85 cells were determined by Western blotting analyses (n = 2/group). (I) The ratios of ERα to tubulin in the HTB-85 cells are shown in a graph (n = 3/group). *P < 0.05; **P < 0.01; ***P < 0.001; NS, not significantly different versus vehicle, Student’s t test. Values represent the average ± S.E.M. of three independent experiments.

